Price, (Volume), Support, Resistance, Demand, Supply . . .

Szimba said:
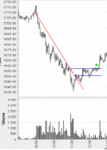
I attach both charts.
This is a very good example how S/R works!
I reposted my original chart and made some annotations which makes easier to compare both charts.
We can see, that S/R didn't came from nothing, instead it's origination could be find in the previous chart.

The context didn't change my previous view because it didn't add any new potential support or resistance.

The only difference is that now we can understand why did price find support around 48 after breaking down at red3 and the same applies for the area around 42. (where price find support before breaking stage 1 trendline)

I did not state that these are futures charts, but because they are, I'd be cautious about labelling that first bar an air pocket since futures trade overnight and these are not continuous charts. Plus gaps sometimes do not fill, at least not right away, particularly if they're breakaway gaps. Which is why I like to give a price that's gapped a little time to find it own levels before I act, and even then I generally don't do anything unless it has gapped above R or below S, and it did neither in this case. But that's me.

A better example of what could be called an air pocket occurs over "7", from 56 to 52 (with a different bar interval, this would be one bar; are you able yet to see different bar intervals without actually plotting them?), and this may account for some of the back-and-fill at the next day's open. Or not.

Db
 
firewalker99 said:
I've noticed your lines are pretty similar to the ones I've drawn (except they're longer but that's beside the point). One question however: the upper line around 51, why not around 52? Do you consider this to be a zone. I tried to interpret the chart reading from left to right only, but noticed that a S/R line drawn at 52 - so not at the outer edges of the bottoms - crosses with a new top between C-D. Let's say you drew a S at 51, what would you make of that particular price movement then?

When I started to draw support line at 51, the top you mentioned was a future. It didn't exist at that time, therefore I wouldn't expect price to find resistance at 52. I mean I wouldn't say it has more possibility to turn from 52 than say 52,8. Even if I draw a support somewhere it doesn't mean that price has to do something there, maybe no other trader is interested at that level just me.
 
dbphoenix said:
are you able yet to see different bar intervals without actually plotting them?
Db

Yes, blending candles to one single candle is not a problem.
The reverse can not be done, that is why I have to look at lower time frames.
I.e a hammer can be formed in a thousand way and not always masking the same trader behaviour. (Lets compare a steep decline in the first hour and then a steady rise versus an intra-day double bottom or a steady falling throughout the day with a sharp rising in the last hour.
 
Szimba said:
Yes, blending candles to one single candle is not a problem.
The reverse can not be done, that is why I have to look at lower time frames.
I.e a hammer can be formed in a thousand way and not always masking the same trader behaviour. (Lets compare a steep decline in the first hour and then a steady rise versus an intra-day double bottom or a steady falling throughout the day with a sharp rising in the last hour.

However, if you're using the EOD bar as a signal, this doesn't necessarily matter, i.e., the destination matters more than the journey. If you're going within the bar to make your entry, such as with an hourly chart, that's a different matter, but then you're not trading the hammer per se.

There is also the matter of entry and whether you jump in because it seems "right" or you wait for the price to move in the desired direction, such as with a buystop above the PDH.

But as I said in the Practicum, there are loads of hammers that mean nothing at all. The hammers that represent genuine turning points are more rare, and you just have to wait for them.

And I know you're using the hammer only as an example. But if you spend enough time watching these charts in real time and watching the wider-interval bars form, you'll find that you're referring to the smaller-interval charts less and less.

Db
 
Db,
Kudos on your P/V corpus - the cheque is in the mail.
ljey

A little Learning is a dang'rous Thing;
Drink deep, or taste not the Pierian Spring:
There shallow Draughts intoxicate the Brain,
And drinking largely sobers us again.


Alexander Pope, An Essay on Criticism
 
dbphoenix said:
In the meantime, watch the bars form in real time. You get a very different sense of buying/selling pressure than you do by studying volume and price bars in hindsight.

What should one be looking for then?
If looking at a 5min chart, it takes 5 minutes to form the bar and I've noticed sometimes price slowly drops, then swings up in a flip second, and so on until the bar finally finishes at the top. Or vice versa. But when watching bars form in realtime, are you not paying to much attention to the single bars instead of the forest?
 
firewalker99 said:
What should one be looking for then?
If looking at a 5min chart, it takes 5 minutes to form the bar and I've noticed sometimes price slowly drops, then swings up in a flip second, and so on until the bar finally finishes at the top. Or vice versa. But when watching bars form in realtime, are you not paying to much attention to the single bars instead of the forest?

If watching the 5m bars form in real time does nothing for you, then watch a tick chart alongside while also watching a 15m chart, a 60m chart, and a daily chart.

Db
 
dbphoenix said:
But if you spend enough time watching these charts in real time and watching the wider-interval bars form, you'll find that you're referring to the smaller-interval charts less and less.

Db

This is a very important observation.
 
if price moves, it forms a channel...if it moves in same direction for a bit...imho..emini daytrading ......that is why demand and supply lines can be hand drawn each day with basically same picture ..we can see the chart as price moves and not needing lines to show us the channels, trend, springboards, triangles, converging/ascending/descending/ ..up down and chop/whipsaw....... .....u showed me the how to draw the 1 2 3 supply demand lines db along time ago on ET forum, which by the way is still a zoo.........i don't like your 5 min charts...i use the 10 min......... i ended up on NQ as you traded then.......i traded nq years ago but it whipped me too many times...........i am not qualified to trade 5 min yet......not sharp enough to do them......i know s/r works if u know which ones are the real mccoy's......not the one s that blow out even without a whimper as price zooms past them the first run at them......you know how to read that and that truly is good stuff.....price and volume is truly about all one needs if skills reach that level.......... i know that is all we need ......just not going to happen without sweat and tears......i am a very weak trader but slowly moving forward as useless stuff is thrown overboard....thanks db....your comments are appreciated........ if this is too off topic just say stop and i will repect your wishes but will continue to read your posts....
 
Posted elsewhere:

Everyone says it: "Keep it Simple, blah blah blah..."

But no one tells us how to keep it simple. If it was that simple, then why doesn't anybody tell us about keeping it simple. Would it be that hard?


Lots of trading magazines and books have already told you that. They tell you to keep it simple by not overcomplicating things with indicators, etc, and if you read enough of them, it all comes down to price, time, and volume along with the basics of stop loss, risk management, etc.

That is the concept, and that is THE SIMPLEST FORM that anyone, including your mentor, is able to tell you. Don't expect someone, including your mentor, to tell you when to buy and when to sell without experiencing the market yourself and further enhancing yourself. Your mentor can tell you so much with trendlines, S/R , or once x setup happens, then price most likely will go up or down. The market changes and can go against you anytime. After you experience the market and actually trade to a point/level of breakeven, you will know how simple -- but not easy -- the market action and trading is.

It's almost like the game of baseball. I tell you it's a simple game. All you do is just hit the ball by swinging the bat when the ball is coming at you, especially a fastball which usually comes in straight and fast, about 95mph, and this pitcher is usually going to give you fastballs. So with this knowledge, you think it's easy and step up to the plate with confidence. Then the pitcher does throw a fastball ball to you. From your perspective, it seems to be coming in at 95 mph. So you take a big swing, but by the time you swing the bat, the ball has already whizzed by you. Sorry, you misjudged it because the ball was coming in at 99, not 95 mph. Could've hit a homerun or extra base hit if you had swung at it a split second earlier.

Then on the next pitch. You are sitting on a fastball, and this time you swing a bit earlier than last time. But sorry, this time you swung too early; the ball is NOT coming in at 99 mph, but at 91 mph, and at a slightly different location. But hey, it's still a fastball. Why did you miss it!??

So you, getting pissed off or a bit pressured and scared, are now waiting for the next pitch, perhaps your last one. This time you will try to time it correctly. The pitch comes in. Ah, it's a slower one, going at about 85 mph. You wait a bit and swing perfectly at the perfect time. But still nothing. The ball drops down suddenly and you are left with nothing but swinging at air. The pitcher (market) psyched you out with a nastly sinker. You lose.

Hey, forget the last pitch, but you had 2 chances to hit a fastball. I even told you he is going to give you fastballs, and I told you the behavior of a fastball a thousand times. But why did you miss it? It's so simple!?? It's direct and it's fast, but watch the speed and also the location where it's about to be. If it's outside your reach, don't swing. If it's within your reach, swing at the location where it's coming in. That's it! See, it's simple, and that's the simplest form I can put it in. Don't understand why you still can't hit the ball!

Hope you get the point.

--bwc
 
dbphoenix said:
As to your response to the chart I posted, you say that #1 and 2 would be shorting ops. Then you'd just wander. Why wander? How would you manage your risk? Would you not try to manage the trade in some way? How?

Db

Seems I looked over these questions you directed to me. I saw two possible shorting entries on the chart. For trade management I'd look for a first exit at 2x ATR, second 3x ATR, stop at 1x ATR. (Now I know this isn't an intraday chart, but let's say it this). I would enter with two contracts, after the first target was hit, I'd place my stop at BE. With "wander" I meant that I didn't see another possible entry on the chart apart from these two in alignment with the definitions in my trading plan. If I were to trade three contracts, I could let the third "run" after my first two targets were hit.
 
rols said:
May I suggest you try a different approach temporarily before analysis by paralysis completely takes over?

When the DAX opens next (I chose this because you mentioned it previously)just passively observe the price action alone and nothing else. The aim is to become the market, to internalise and flow with the other thousands of traders doing the same as you. This may sound touch feely BS but just try it. After a while you'll see where all the S & R levels are and more importantly the character of this market will become something you know and with much practise will be to some extent become predictable. Then when that stage is reached it will be time to get the charts back up and depending on how your unique intuitive reading of the market has formed then you in turn will be able to develop your own strategies relevent to your interpretation.

I hope this is of some help...

Hello, although I appreciate the feedback and suggestion, I've been through that phase a while ago. Day after day I observed the charts in realtime, especially the opening and what happened next. Indeed, at some days I had a "feeling" if you want to call it that way that price was forming support (or resistance). Unfortunately each time I acted on those, price just turned away, dropped right through support or broke resistance and there I stood again. Frustrated, agitated, unable to comprehend why this happened or why I wasn't able to do anything about it, I banged my head against the wall for losing an increasingly amount of money.

So perhaps I'll never become one of those people who claim they have acquired an "intuitive" feeling for the market (if you happen to be one of those then hats off). Or perhaps all those people don't have an intuitive feeling but for them it feels so intuitively because there acting on their system all over again, trading just their plan, following every step, entry, exit, position sizing... It's become such a habit that it's almost a routine check that it feels like driving a car. You know where to shift up or down after a while, even without looking at your speed or RPM. Or you can "sense" how fast you're going without having a speedometer.... In any case, if you're saying one can acquire a sense to "predict" the way price is going to move in the next couple of seconds, minutes or hours then I'd be truly amazed if someone could act on it in a profitable way. Unless you equate predicting price movement with defining a x% chance of price going in that direction...
 
Last edited:
firewalker99 said:
Hello, although I appreciate the feedback and suggestion, I've been through that phase a while ago. Day after day I observed the charts in realtime, especially the opening and what happened next. Indeed, at some days I had a "feeling" if you want to call it that way that price was forming support (or resistance). Unfortunately each time I acted on those, price just turned away, dropped right through support or broke resistance and there I stood again. Frustrated, agitated, unable to comprehend why this happened or why I wasn't able to do anything about it, I banged my head against the wall for losing an increasingly amount of money.

So perhaps I'll never become one of those people who claim they have acquired an "intuitive" feeling for the market (if you happen to be one of those then hats off). Or perhaps all those people don't have an intuitive feeling but for them it feels so intuitively because there acting on their system all over again, trading just their plan, following every step, entry, exit, position sizing... It's become such a habit that it's almost a routine check that it feels like driving a car. You know where to shift up or down after a while, even without looking at your speed or RPM. Or you can "sense" how fast you're going without having a speedometer.... In any case, if you're saying one can acquire a sense to "predict" the way price is going to move in the next couple of seconds, minutes or hours then I'd be truly amazed if someone could act on it in a profitable way. Unless you equate predicting price movement with defining a x% chance of price going in that direction...

Ironically as is with many things in life the harder you try and by trying I mean the urge to grasp control by asserting ones will and if this fails then allowing ones emotions to to somehow right the listing ship, the less likely you are to succeed.

The one thing that all masters of their crafts have in common is that they make it look astonishingly easy and for the bulk of the time seem to be playing well within themselves. If trading feels difficult then I reckon a change of approach is needed hence my suggestion of passive observation.

We have all experienced the frustration of being all at sea when we are trading and yet it seems that many traders on these boards take no action to correct the obvious faults which lie within themselves. Instead each failure is followed by yet more intensive technical analysis study, more seeking of the magic indicator or wonder strategy that will work in any market at any time.

Look at yourselves and not your charts and I promise the results will be rewarding not only financially but in other ways you cannot begin to imagine.
 
rols said:
Ironically as is with many things in life the harder you try and by trying I mean the urge to grasp control by asserting ones will and if this fails then allowing ones emotions to to somehow right the listing ship, the less likely you are to succeed.

The one thing that all masters of their crafts have in common is that they make it look astonishingly easy and for the bulk of the time seem to be playing well within themselves. If trading feels difficult then I reckon a change of approach is needed hence my suggestion of passive observation.

We have all experienced the frustration of being all at sea when we are trading and yet it seems that many traders on these boards take no action to correct the obvious faults which lie within themselves. Instead each failure is followed by yet more intensive technical analysis study, more seeking of the magic indicator or wonder strategy that will work in any market at any time.

Look at yourselves and not your charts and I promise the results will be rewarding not only financially but in other ways you cannot begin to imagine.
I must comment you are quite right rols ~ you have hit the nail right on the head.

I am not going to say it is a matter of intelligence only, but intelligence is useless without the self generated "extra ingredient" necessary to progress.

One example of this unwillingness to go further is illustrated by the response Firewalker has experienced with regard to his post number 90 on the thread, The Mirror of Erised.

If he is willing to post the two charts he discussed in that post that caused him so much bother...if he is wiling to post them today...right here..... I am willing...... as a one off......to illuminate them for him.

If he does this, he is certain to find the explanation I am willing to give him will satisfy his curiosity.
 
Good, Very Good, firewalker, I can see you are looking, so when you are ready...
 
SOCRATES said:
Good, Very Good, firewalker, I can see you are looking, so when you are ready...

I'm not sure what you're asking... you refer to a post #90 in the S/R Mirror of Erised thread but my count only goes to #82. I'm assuming you mean #80 ? I did attach the two charts I discussed, so I'm not sure what you want me to do next...
 
SOCRATES said:
Yes, that is right........just post the two charts...

Ok no problem!
 

Attachments

  • sc.GIF
    sc.GIF
    23.2 KB · Views: 381
  • SC1.GIF
    SC1.GIF
    52.1 KB · Views: 407
Top