Predicting future FX support and resistance levels using mathematics

GBPUSD trade 10th May - BoE Interest Rate Decision

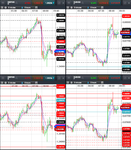
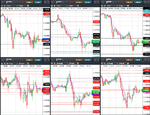
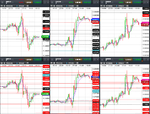
I attach the weekly VRM levels in the top 5 minute charts, daily VRM levels in the bottom 5 minute charts. Times are GMT-4 . EMA channel (4,7) included.

Prior to the BoE Interest Rate Decision the GBPUSD bounced down off daily level 1.3608 and weekly sentiment level 1.3609. EURGBP had also bounced up off its long term trend channel middle at 0.8729 and had support on its weekly sentiment level 0.8736. All signals indicated sell GBP.

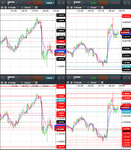
I attach my GBPUSD sell trade prior to the BoE Interest Rate Decision and its close just above weekly sentiment level 1.3510 where support started. 88.1 basis points profit.
 

Attachments

  • 2018-05-10-GBPUSD-EURGBP-5min-0902.png
    2018-05-10-GBPUSD-EURGBP-5min-0902.png
    305.8 KB · Views: 99
  • 2018-05-10-GBPUSD-Sell-Trade-BoE-Interest-Rate-Decision.png
    2018-05-10-GBPUSD-Sell-Trade-BoE-Interest-Rate-Decision.png
    87.7 KB · Views: 95
I attach the weekly VRM levels in the top 5 minute charts, daily VRM levels in the bottom 5 minute charts. Times are GMT-4 . EMA channel (4,7) included.

Prior to the BoE Interest Rate Decision the GBPUSD bounced down off daily level 1.3608 and weekly sentiment level 1.3609. EURGBP had also bounced up off its long term trend channel middle at 0.8729 and had support on its weekly sentiment level 0.8736. All signals indicated sell GBP.

I attach my GBPUSD sell trade prior to the BoE Interest Rate Decision and its close just above weekly sentiment level 1.3510 where support started. 88.1 basis points profit.

demo trading is fun eh! :clap:
 
...I attach my GBPUSD sell trade prior to the BoE Interest Rate Decision and its close just above weekly sentiment level 1.3510 where support started. 88.1 basis points profit.
Great.

Rather than ex post facto; It would be nice if you posted your trades/calls soon after they're made. Doesn't matter if it's demo or not, or just calls.

Doing so would better show the raw efficacy of your 'system' ... and ensure that you aren't cherry picking and only revealing successful trades.
 
GBPUSD, EURGBP & EURUSD results for 10th May - BoE Interest Rate Decision

Yesterday I attached the predicted support and resistance levels of GBPUSD of the Volatility Response Model (VRM) for today.

EURGBP and EURUSD VRM levels and 10 other FX pairs were on the website

https://www.complexhamiltoniansystems.com/fxcharts/

Here are the results for GBPUSD, EURGBP & EURUSD.

TWO ATTACHMENTS

FIRST ATTACHMENT

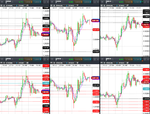
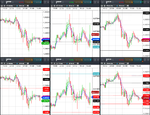
Weekly VRM levels in the top 30 minute charts, daily VRM levels in the bottom 30 minute charts. Times are GMT-4 . EMA channel (4,7) included.

GBPUSD high for the day at daily level 1.3608. Low for the day at level 1.3477.

SECOND ATTACHMENT

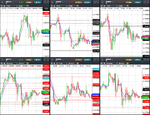
Weekly VRM levels in the top 5 minute charts, daily VRM levels in the bottom 5 minute charts. Times are GMT-4 . EMA channel (4,7) included. Chart about the BoE Interest Rate Decision at 8 am (GMT-4)

See my last post for a description of the GBPUSD just before the BoE Interest Rate Decision

There were some large gaps between VRM levels to trade between.
 

Attachments

  • 2018-05-10-GBPUSD-EURGBP-EURUSD-30min.png
    2018-05-10-GBPUSD-EURGBP-EURUSD-30min.png
    379 KB · Views: 132
  • 2018-05-10-GBPUSD-EURGBP-5min-0902.png
    2018-05-10-GBPUSD-EURGBP-5min-0902.png
    305.8 KB · Views: 95
Great.

Rather than ex post facto; It would be nice if you posted your trades/calls soon after they're made. Doesn't matter if it's demo or not, or just calls.

Doing so would better show the raw efficacy of your 'system' ... and ensure that you aren't cherry picking and only revealing successful trades.

Thank you for your feedback. Point taken.
 
GBPUSD predictions for 11th May

I attach the VRM predictions for GBPUSD for tonight and tomorrow finishing 5 pm 11th May in New York.

The predictions are now in chart format and CSV format for input into charting systems. Predictions are in the column format of date, high, low, close, trend channel top, bottom and middle and 24 dual columns for the VRM levels. The last entry gives today's predictions and this week's predictions. The CSV file also gives past results for the VRM for back testing trading strategies. As the current day and week have not finished, the high, low and close entries are set to zero for these dates. The FX chart corresponds to the last daily and weekly CSV file entries.

Documents describing the Volatility Response Model (VRM) and the chart format can be found on the first post of this thread.

Predictions for VRM levels of EURGBP and EURUSD and 10 other FX pairs can be found at

https://www.complexhamiltoniansystems.com/fxcharts/

My current trading strategy is on page #20 post #157 of this thread.
 

Attachments

  • gbpusd.PNG
    gbpusd.PNG
    59.7 KB · Views: 100
  • GBP-USD-DAILY.CSV
    46 KB · Views: 113
  • GBP-USD-WEEKLY.CSV
    46 KB · Views: 118
Great.

Rather than ex post facto; It would be nice if you posted your trades/calls soon after they're made. Doesn't matter if it's demo or not, or just calls.

Doing so would better show the raw efficacy of your 'system' ... and ensure that you aren't cherry picking and only revealing successful trades.

unfortunately the VRM posting bot is programmed to cherry pick, from a random scattering of levels, the levels that are hit - and then it generates the next post
 
Last edited:
GBPUSD, EURGBP & EURUSD results for 11th May

Yesterday I attached the predicted support and resistance levels of GBPUSD of the Volatility Response Model (VRM) for today.

EURGBP and EURUSD VRM levels and 10 other FX pairs were on the website

https://www.complexhamiltoniansystems.com/fxcharts/

Here are the results for GBPUSD, EURGBP & EURUSD.

TWO ATTACHMENTS

FIRST ATTACHEMENT

Weekly VRM levels in the top 30 minute charts, daily VRM levels in the bottom 30 minute charts. Times are GMT-4 . EMA channel (4,7) included.

Today the GBPUSD sold off down to the lowest weekly sentiment level 1.3510 / daily S1 sentiment level 1.3508 before rallying to weekly sentiment level 1.3583 / daily level 1.3582.

Daily and weekly levels are calculated using completely different data sets. To get daily and weekly levels that agree within 1 or 2 basis points from different data sets is quite amazing to me.

SECOND ATTACHMENT

I wasn't trading today so I have annotated the 5 minute chart attached starting 9 am . Weekly VRM levels in the top 5 minute charts, daily VRM levels in the bottom 5 minute charts. Times are GMT-4 . EMA channel (4,7) included.

LEGEND

B = BUY
C = CLOSE
S = SELL

These are the entry and exit points using 5 minute charts described in my current trading strategy on page #20 post #157 of this thread. Three trades identified.

There were some large gaps between VRM levels to trade between.
 

Attachments

  • 2018-05-11-GBPUSD-5min-1405 - annotated.png
    2018-05-11-GBPUSD-5min-1405 - annotated.png
    147.4 KB · Views: 128
  • 2018-05-11-GBPUSD-EURGBP-EURUSD-30min.png
    2018-05-11-GBPUSD-EURGBP-EURUSD-30min.png
    370.5 KB · Views: 101
GBPUSD predictions for 14th May

I attach the VRM predictions for GBPUSD for tonight and tomorrow finishing 5 pm 14th May in New York.

The predictions are now in chart format and CSV format for input into charting systems. Predictions are in the column format of date, high, low, close, trend channel top, bottom and middle and 24 dual columns for the VRM levels. The last entry gives today's predictions and this week's predictions. The CSV file also gives past results for the VRM for back testing trading strategies. As the current day and week have not finished, the high, low and close entries are set to zero for these dates. The FX chart corresponds to the last daily and weekly CSV file entries.

Documents describing the Volatility Response Model (VRM) and the chart format can be found on the first post of this thread.

Predictions for VRM levels of EURGBP and EURUSD and 10 other FX pairs can be found at

https://www.complexhamiltoniansystems.com/fxcharts/

My current trading strategy is on page #20 post #157 of this thread.
 

Attachments

  • gbpusd.PNG
    gbpusd.PNG
    60.6 KB · Views: 96
  • GBP-USD-DAILY.CSV
    46 KB · Views: 115
  • GBP-USD-WEEKLY.CSV
    46 KB · Views: 105
GBPUSD, EURGBP & EURUSD results for 14th May

Yesterday I attached the predicted support and resistance levels of GBPUSD of the Volatility Response Model (VRM) for today.

EURGBP and EURUSD VRM levels and 10 other FX pairs were on the website

https://www.complexhamiltoniansystems.com/fxcharts/

Here are the results for GBPUSD, EURGBP & EURUSD.

The short and long term trend channels featured today.

The GBPUSD low for the day was the daily S1 sentiment level 1.3539.

The high for the day was the bottom of the long term trend channel 1.3609. I have the high for the day as 1.36088.

The GBPUSD then closed the day at the middle of the short term trend channel at 1.3556.

There were some large gaps between VRM levels to trade between.
 

Attachments

  • 2018-05-14-GBPUSD-EURGBP-EURUSD-30min.png
    2018-05-14-GBPUSD-EURGBP-EURUSD-30min.png
    351.3 KB · Views: 88
GBPUSD predictions for 15th May

I attach the VRM predictions for GBPUSD for tonight and tomorrow finishing 5 pm 15th May in New York.

The predictions are now in chart format and CSV format for input into charting systems. Predictions are in the column format of date, high, low, close, trend channel top, bottom and middle and 24 dual columns for the VRM levels. The last entry gives today's predictions and this week's predictions. The CSV file also gives past results for the VRM for back testing trading strategies. As the current day and week have not finished, the high, low and close entries are set to zero for these dates. The FX chart corresponds to the last daily and weekly CSV file entries.

Documents describing the Volatility Response Model (VRM) and the chart format can be found on the first post of this thread.

Predictions for VRM levels of EURGBP and EURUSD and 10 other FX pairs can be found at

https://www.complexhamiltoniansystems.com/fxcharts/

My current trading strategy is on page #20 post #157 of this thread.
 

Attachments

  • GBP-USD-WEEKLY.CSV
    46 KB · Views: 116
  • GBP-USD-DAILY.CSV
    46 KB · Views: 116
  • gbpusd.PNG
    gbpusd.PNG
    60.3 KB · Views: 101
GBPUSD, EURGBP & EURUSD results for 15th May

Yesterday I attached the predicted support and resistance levels of GBPUSD of the Volatility Response Model (VRM) for today.

EURGBP and EURUSD VRM levels and 10 other FX pairs were on the website

https://www.complexhamiltoniansystems.com/fxcharts/

Here are the results for GBPUSD, EURGBP & EURUSD.

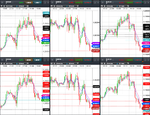
Weekly VRM levels in the top 1 hour charts, daily VRM levels in the bottom 1 hour charts. Times are GMT-4 . EMA channel (4,7) included.

GBPUSD high for the day was at weekly S1 sentiment level 1.3569.

GBPUSD found temporary support at the lowest daily sentiment level 1.3529 but could not close above the middle of the short term trend channel 1.3558.

Then fell to its low at 1.3464.

This coincided with the EURUSD low for its day at weekly level 1.1823.

There were some large gaps between VRM levels to trade between.
 

Attachments

  • 2018-05-15-GBPUSD-EURGBP-EURUSD-1hr.png
    2018-05-15-GBPUSD-EURGBP-EURUSD-1hr.png
    440.2 KB · Views: 117
GBPUSD predictions for 16th May

I attach the VRM predictions for GBPUSD for tonight and tomorrow finishing 5 pm 16th May in New York.

The predictions are now in chart format and CSV format for input into charting systems. Predictions are in the column format of date, high, low, close, trend channel top, bottom and middle and 24 dual columns for the VRM levels. The last entry gives today's predictions and this week's predictions. The CSV file also gives past results for the VRM for back testing trading strategies. As the current day and week have not finished, the high, low and close entries are set to zero for these dates. The FX chart corresponds to the last daily and weekly CSV file entries.

Documents describing the Volatility Response Model (VRM) and the chart format can be found on the first post of this thread.

Predictions for VRM levels of EURGBP and EURUSD and 10 other FX pairs can be found at

https://www.complexhamiltoniansystems.com/fxcharts/

My current trading strategy is on page #20 post #157 of this thread.
 

Attachments

  • gbpusd.PNG
    gbpusd.PNG
    60.6 KB · Views: 135
  • GBP-USD-DAILY.CSV
    46 KB · Views: 117
  • GBP-USD-WEEKLY.CSV
    46 KB · Views: 117
GBPUSD, EURGBP & EURUSD results for 16th May

Yesterday I attached the predicted support and resistance levels of GBPUSD of the Volatility Response Model (VRM) for today.

EURGBP and EURUSD VRM levels and 10 other FX pairs were on the website

https://www.complexhamiltoniansystems.com/fxcharts/

Here are the results for GBPUSD, EURGBP & EURUSD.

Weekly VRM levels in the top 1 hour charts, daily VRM levels in the bottom 30 minute charts. Times are GMT-4 . EMA channel (4,7) included.

GBPUSD rose to the high for the day at daily sentiment level 1.3515. Then fell to its lowest weekly sentiment level 1.3474. It could not pull the 1 hour EMA(4,7) through this level.

The GBPUSD low for the day happened at the same time as the EURUSD low for its day at daily level 1.1766. Having fallen from its high for the day at daily S1 sentiment level 1.1848.

EURGBP also bounced twice of its weekly sentiment level 0.8732

There were some large gaps between VRM levels to trade between.
 

Attachments

  • 2018-05-16-GBPUSD-EURGBP-EURUSD-1hr-30min.png
    2018-05-16-GBPUSD-EURGBP-EURUSD-1hr-30min.png
    383.6 KB · Views: 112
GBPUSD predictions for 17th May

I attach the VRM predictions for GBPUSD for tonight and tomorrow finishing 5 pm 17th May in New York.

The predictions are now in chart format and CSV format for input into charting systems. Predictions are in the column format of date, high, low, close, trend channel top, bottom and middle and 24 dual columns for the VRM levels. The last entry gives today's predictions and this week's predictions. The CSV file also gives past results for the VRM for back testing trading strategies. As the current day and week have not finished, the high, low and close entries are set to zero for these dates. The FX chart corresponds to the last daily and weekly CSV file entries.

Documents describing the Volatility Response Model (VRM) and the chart format can be found on the first post of this thread.

Predictions for VRM levels of EURGBP and EURUSD and 10 other FX pairs can be found at

https://www.complexhamiltoniansystems.com/fxcharts/

My current trading strategy is on page #20 post #157 of this thread.
 

Attachments

  • GBP-USD-WEEKLY.CSV
    46 KB · Views: 116
  • GBP-USD-DAILY.CSV
    46 KB · Views: 110
  • gbpusd.PNG
    gbpusd.PNG
    60 KB · Views: 97
Now what's your thoughts on the case where pound drops to 1.33 and then rebounds? How likely is that scenario to happen?
 
Will 1.33 be a GBPUSD rebound level ?

Now what's your thoughts on the case where pound drops to 1.33 and then rebounds? How likely is that scenario to happen?

I attach today's VRM chart again to explain my understanding.

The current GBPUSD value is outside the long term trend channel (green channel) which from top to bottom has a range of 700 pips. Bottom is 1.3609.

The GBPUSD value is also below the short term trend channel middle (blue channel at 1.3551) which has a range of 377 pips.

Until the GBPUSD closes the week back inside the long term trend channel it is extremely bearish.

Until GBPUSD closes the week above the long term trend channel middle (which is currently 1.3959) then GBPUSD is long term bearish.

Until the GBPUSD closes the day above the middle of the short term trend channel (which today is 1.3551) it is short term bearish.

Suppose there was some extreme news today that drove the GBPUSD down dramatically then the only weekly VRM levels close to 1.33 are

L3 = 1.3336
L5 = 1.3235

that's 101 pips pf separation. The GBPUSD may bounce upwards from these levels but it has to close the week above the long term trend channel middle (green) before any major change in trend of GBPUSD takes place.

So currently you may take some short term profit off weekly levels L3 or L5 after extreme news but there will be no long term trend to follow until the GBPUSD closes above the middle of the long term trend channel.

After the close tonight in New York the daily levels will be recalculated for tomorrow. After the close on Friday the weekly levels lasting next Monday through Friday will be recalculated.

I believe that it is not a support level that causes an FX pair to rise but the dissipation of a resistance level above.

And vice versa I believe that it is not a resistance level that causes an FX pair to fall but the dissipation of a support level below.
 

Attachments

  • gbpusd.PNG
    gbpusd.PNG
    60 KB · Views: 102
GBPUSD, EURGBP & EURUSD results for 17th May

Yesterday I attached the predicted support and resistance levels of GBPUSD of the Volatility Response Model (VRM) for today.

EURGBP and EURUSD VRM levels and 10 other FX pairs were on the website

https://www.complexhamiltoniansystems.com/fxcharts/

Here are the results for GBPUSD, EURGBP & EURUSD.

Weekly VRM levels in the top 1 hour charts, daily VRM levels in the bottom 1 hour charts. Times are GMT-4 . EMA channel (4,7) included.

GBPUSD rallied on the market open last night from daily S1 sentiment level 1.3486 to the day's high at weekly S1 sentiment level 1.3569. I have 1.35698 as the day's high.

The GBPUSD then fell to the day's low at the lowest weekly sentiment level 1.3474. I have today's low as 1.3474.

There were some large gaps between VRM levels to trade between.
 

Attachments

  • 2018-05-17-GBPUSD-EURGBP-EURUSD-1hr-30min.png
    2018-05-17-GBPUSD-EURGBP-EURUSD-1hr-30min.png
    441.4 KB · Views: 102
GBPUSD predictions for 18th May

I attach the VRM predictions for GBPUSD for tonight and tomorrow finishing 5 pm 18th May in New York.

The predictions are now in chart format and CSV format for input into charting systems. Predictions are in the column format of date, high, low, close, trend channel top, bottom and middle and 24 dual columns for the VRM levels. The last entry gives today's predictions and this week's predictions. The CSV file also gives past results for the VRM for back testing trading strategies. As the current day and week have not finished, the high, low and close entries are set to zero for these dates. The FX chart corresponds to the last daily and weekly CSV file entries.

Documents describing the Volatility Response Model (VRM) and the chart format can be found on the first post of this thread.

Predictions for VRM levels of EURGBP and EURUSD and 10 other FX pairs can be found at

https://www.complexhamiltoniansystems.com/fxcharts/

My current trading strategy is on page #20 post #157 of this thread.
 

Attachments

  • gbpusd.PNG
    gbpusd.PNG
    60.4 KB · Views: 101
  • GBP-USD-DAILY.CSV
    46 KB · Views: 126
  • GBP-USD-WEEKLY.CSV
    46 KB · Views: 120
GBPUSD, EURGBP & EURUSD results for 18th May

Yesterday I attached the predicted support and resistance levels of GBPUSD of the Volatility Response Model (VRM) for today.

EURGBP and EURUSD VRM levels and 10 other FX pairs were on the website

https://www.complexhamiltoniansystems.com/fxcharts/

Here are the results for GBPUSD, EURGBP & EURUSD.

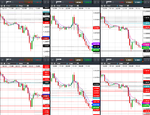
Weekly VRM levels in the top 30 minute charts, daily VRM levels in the bottom 30 minute charts. Times are GMT-4 . EMA channel (4,7) included.

GBPUSD high for the day at daily sentiment level 1.3531 occurred as EURUSD achieved its high at weekly level 1.1823.

Both then fell to their lows with EURUSD for the day at weekly level 1.1751.

GBPUSD has failed to close inside its long term trend channel at the end of this week.

There were some large gaps between VRM levels to trade between.
 

Attachments

  • 2018-05-18-GBPUSD-EURGBP-EURUSD-30min.png
    2018-05-18-GBPUSD-EURGBP-EURUSD-30min.png
    307.5 KB · Views: 93
Top