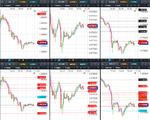
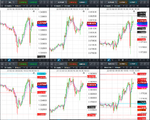
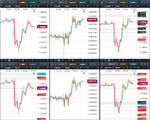
Predicting future FX support and resistance levels using mathematics

GBPUSD predictions for 1st June

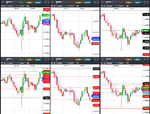
I attach the VRM predictions for GBPUSD for tonight and tomorrow finishing 5 pm 1st June in New York.

The predictions are now in chart format and CSV format for input into charting systems. Predictions are in the column format of date, high, low, close, trend channel top, bottom and middle and 24 dual columns for the VRM levels. The last entry gives today's predictions and this week's predictions. The CSV file also gives past results for the VRM for back testing trading strategies. As the current day and week have not finished, the high, low and close entries are set to zero for these dates. The FX chart corresponds to the last daily and weekly CSV file entries.

Documents describing the Volatility Response Model (VRM) and the chart format can be found on the first post of this thread.

Predictions for VRM levels of EURGBP and EURUSD and 10 other FX pairs can be found at


My current trading strategy is on page #20 post #157 of this thread.
 

Attachments

  • gbpusd.PNG
    gbpusd.PNG
    59.5 KB · Views: 97
  • GBP-USD-DAILY.CSV
    46 KB · Views: 90
  • GBP-USD-WEEKLY.CSV
    46 KB · Views: 83
Last edited by a moderator:
GBPUSD follows EURUSD during Non Farm Payroll

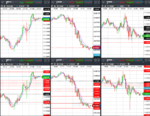
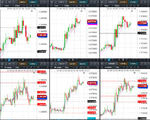
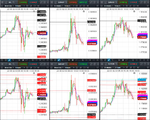
I attach the 5 minute charts for GBPUSD, EURGBP & EURUSD during the Non Farm Payroll

Weekly VRM levels in the top 5 minute charts, daily VRM levels in the bottom 5 minute charts. Times are GMT-4 . EMA channel (4,7) included.

Prior to the NFP , EURUSD had support on its lowest daily sentiment level 1.1667. GBPUSD was following.

On the NFP announcement EURUSD fell to its daily level 1.1647. I have the daily low for EURUSD today so far as 1.16472. GBPUSD followed.

EURUSD then rose to its daily S1 sentiment level 1.1688. GBPUSD followed.
 

Attachments

  • 2018-06-01-GBPUSD-EURGBP-EURUSD-5min-1045.png
    2018-06-01-GBPUSD-EURGBP-EURUSD-5min-1045.png
    328.4 KB · Views: 114
GBPUSD, EURGBP & EURUSD results for 1st June - Non Farm Payroll

Yesterday I attached the predicted support and resistance levels of GBPUSD of the Volatility Response Model (VRM) for today.

EURGBP and EURUSD VRM levels and 10 other FX pairs were on the website


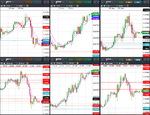
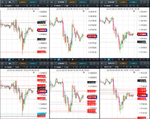
Here are the results for GBPUSD, EURGBP & EURUSD.

Weekly VRM levels in the top 30 minute charts, daily VRM levels in the bottom 30 minute charts. Times are GMT-4 . EMA channel (4,7) included.

Overall today was a buy GBP day with the NFP in the middle and EURUSD a bystander.

GBPUSD low for the day was at 1.3253 as EURGBP approach its day's high below weekly level 0.8819.

GBPUSD then rose to weekly sentiment level 1.3361 / daily level 1.3361 while EURGBP fell to its daily level 0.8730.

See my previous post with the 5 minute charts for GBPUSD & EURUSD about the NFP

There were some large gaps between VRM levels to trade between.
 

Attachments

  • 2018-06-01-GBPUSD-EURGBP-EURUSD-30min.png
    2018-06-01-GBPUSD-EURGBP-EURUSD-30min.png
    235.2 KB · Views: 111
Last edited by a moderator:
GBPUSD predictions for 4th June

I attach the VRM predictions for GBPUSD for tonight and tomorrow finishing 5 pm 4th June in New York.

The predictions are now in chart format and CSV format for input into charting systems. Predictions are in the column format of date, high, low, close, trend channel top, bottom and middle and 24 dual columns for the VRM levels. The last entry gives today's predictions and this week's predictions. The CSV file also gives past results for the VRM for back testing trading strategies. As the current day and week have not finished, the high, low and close entries are set to zero for these dates. The FX chart corresponds to the last daily and weekly CSV file entries.

Documents describing the Volatility Response Model (VRM) and the chart format can be found on the first post of this thread.

Predictions for VRM levels of EURGBP and EURUSD and 10 other FX pairs can be found on the website

My current trading strategy is on page #20 post #157 of this thread.
 

Attachments

  • GBP-USD-WEEKLY.CSV
    46 KB · Views: 78
  • GBP-USD-DAILY.CSV
    46 KB · Views: 90
  • gbpusd.PNG
    gbpusd.PNG
    59.6 KB · Views: 90
i compared VRM levels with simple fibonacci, and fibonacci was better im afraid
 
GBPUSD, EURGBP & EURUSD results for 4th June

Yesterday I attached the predicted support and resistance levels of GBPUSD of the Volatility Response Model (VRM) for today.

EURGBP and EURUSD VRM levels and 10 other FX pairs were on the website

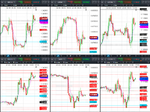
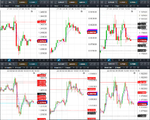
Here are the results for GBPUSD, EURGBP & EURUSD.

Weekly VRM levels in the top 1 hr charts, daily VRM levels in the bottom 30 minute charts. Times are GMT-4 . EMA channel (4,7) included.

GBPUSD rallied to the highest daily sentiment level 1.3373 and then fell back to the weekly S1 sentiment level 1.3360.

Finally making the day's high at weekly sentiment level 1.3388 / daily level 1.3388

Then fell back to the lowest daily sentiment level at 1.3315

There were some large gaps between VRM levels to trade between.
 

Attachments

  • 2018-06-04-GBPUSD-EURGBP-EURUSD-1hr-30min.png
    2018-06-04-GBPUSD-EURGBP-EURUSD-1hr-30min.png
    347 KB · Views: 114
GBPUSD predictions for 5th June

I attach the VRM predictions for GBPUSD for tonight and tomorrow finishing 5 pm 5th June in New York.

The predictions are now in chart format and CSV format for input into charting systems. Predictions are in the column format of date, high, low, close, trend channel top, bottom and middle and 24 dual columns for the VRM levels. The last entry gives today's predictions and this week's predictions. The CSV file also gives past results for the VRM for back testing trading strategies. As the current day and week have not finished, the high, low and close entries are set to zero for these dates. The FX chart corresponds to the last daily and weekly CSV file entries.

Documents describing the Volatility Response Model (VRM) and the chart format can be found on the first post of this thread.

Predictions for VRM levels of EURGBP and EURUSD and 10 other FX pairs can be found on the website

My current trading strategy is on page #20 post #157 of this thread.
 

Attachments

  • GBP-USD-WEEKLY.CSV
    46 KB · Views: 73
  • GBP-USD-DAILY.CSV
    46 KB · Views: 86
  • gbpusd.PNG
    gbpusd.PNG
    59.3 KB · Views: 99
GBPUSD, EURGBP & EURUSD results for 5th June

Yesterday I attached the predicted support and resistance levels of GBPUSD of the Volatility Response Model (VRM) for today.

EURGBP and EURUSD VRM levels and 10 other FX pairs were on the website

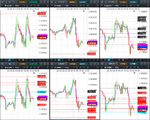
Here are the results for GBPUSD, EURGBP & EURUSD.

Weekly VRM levels in the top 1 hour charts, daily VRM levels in the bottom 30 minute charts. Times are GMT-4 . EMA channel (4,7) included.

GBPUSD started to sell USD at the same time as EURUSD at its level 1.1683.

GBPUSD then rose back to weekly sentiment level 1.3388 before falling back to the short term trend channel middle 1.3333 where it found support.

Meanwhile EURUSD fell to its daily level 1.1656.

Together GBPUSD and EURUSD then rallied.

GBPUSD rose to daily level 1.3403 and EURUSD rose to its highest daily sentiment level 1.1725.

GBPUSD has now closed the day above its short term trend channel middle which is 1.3333 today. If this short term trend channel middle maintains support then GBPUSD is short term bullish.

This is the second day that EURUSD has closed above its short term trend channel middle which today was 1.1660. If this short term trend channel middle maintains support then EURUSD is short term bullish.

There were some large gaps between VRM levels to trade between.
 

Attachments

  • 2018-06-05-GBPUSD-EURGBP-EURUSD-1hr-30min.png
    2018-06-05-GBPUSD-EURGBP-EURUSD-1hr-30min.png
    522.6 KB · Views: 97
GBPUSD predictions for 6th June

I attach the VRM predictions for GBPUSD for tonight and tomorrow finishing 5 pm 6th June in New York.

The predictions are now in chart format and CSV format for input into charting systems. Predictions are in the column format of date, high, low, close, trend channel top, bottom and middle and 24 dual columns for the VRM levels. The last entry gives today's predictions and this week's predictions. The CSV file also gives past results for the VRM for back testing trading strategies. As the current day and week have not finished, the high, low and close entries are set to zero for these dates. The FX chart corresponds to the last daily and weekly CSV file entries.

Documents describing the Volatility Response Model (VRM) and the chart format can be found on the first post of this thread.

Predictions for VRM levels of EURGBP and EURUSD and 10 other FX pairs can be found on the website

My current trading strategy is on page #20 post #157 of this thread.
 

Attachments

  • gbpusd.PNG
    gbpusd.PNG
    59.6 KB · Views: 82
  • GBP-USD-DAILY.CSV
    46 KB · Views: 90
  • GBP-USD-WEEKLY.CSV
    46 KB · Views: 73
GBPUSD, EURGBP & EURUSD results for 6th June

Yesterday I attached the predicted support and resistance levels of GBPUSD of the Volatility Response Model (VRM) for today.

EURGBP and EURUSD VRM levels and 10 other FX pairs were on the website

Here are the results for GBPUSD, EURGBP & EURUSD.

Weekly VRM levels in the top 1 hour charts, daily VRM levels in the bottom 30 minute charts. Times are GMT-4 . EMA channel (4,7) included.

Yesterday the GBPUSD closed above the short term trend channel middle.

Daily sentiment level 1.3401 was the support for today.

The GBPUSD high was at daily level 1.3435

There were some large gaps between VRM levels to trade between.
 

Attachments

  • 2018-06-06-GBPUSD-EURGBP-EURUSD-1hr-30min.png
    2018-06-06-GBPUSD-EURGBP-EURUSD-1hr-30min.png
    550.9 KB · Views: 71
GBPUSD predictions for 7th June

I attach the VRM predictions for GBPUSD for tonight and tomorrow finishing 5 pm 7th June in New York.

The predictions are now in chart format and CSV format for input into charting systems. Predictions are in the column format of date, high, low, close, trend channel top, bottom and middle and 24 dual columns for the VRM levels. The last entry gives today's predictions and this week's predictions. The CSV file also gives past results for the VRM for back testing trading strategies. As the current day and week have not finished, the high, low and close entries are set to zero for these dates. The FX chart corresponds to the last daily and weekly CSV file entries.

Documents describing the Volatility Response Model (VRM) and the chart format can be found on the first post of this thread.

Predictions for VRM levels of EURGBP and EURUSD and 10 other FX pairs can be found on the website

My current trading strategy is on page #20 post #157 of this thread.
 

Attachments

  • GBP-USD-WEEKLY.CSV
    46 KB · Views: 64
  • GBP-USD-DAILY.CSV
    46 KB · Views: 87
  • gbpusd.PNG
    gbpusd.PNG
    59.6 KB · Views: 83
GBPUSD, EURGBP & EURUSD results for 7th June

Yesterday I attached the predicted support and resistance levels of GBPUSD of the Volatility Response Model (VRM) for today.

EURGBP and EURUSD VRM levels and 10 other FX pairs were on the website

Here are the results for GBPUSD, EURGBP & EURUSD.

Weekly VRM levels in the top 30 minute charts, daily VRM levels in the bottom 30 minute charts. Times are GMT-4 . EMA channel (4,7) included.

GBPUSD was trapped in the weekly sentiment levels today.

High for today at weekly sentiment level 1.3471

Low for the day at weekly sentiment level 1.3388

EURUSD bounced off the top of its short term trend channel at 1.1837

There were some large gaps between VRM levels to trade between.
 

Attachments

  • 2018-06-07-GBPUSD-EURGBP-EURUSD-30min.png
    2018-06-07-GBPUSD-EURGBP-EURUSD-30min.png
    594.2 KB · Views: 61
GBPUSD predictions for 8th June

I attach the VRM predictions for GBPUSD for tonight and tomorrow finishing 5 pm 8th June in New York.

The predictions are now in chart format and CSV format for input into charting systems. Predictions are in the column format of date, high, low, close, trend channel top, bottom and middle and 24 dual columns for the VRM levels. The last entry gives today's predictions and this week's predictions. The CSV file also gives past results for the VRM for back testing trading strategies. As the current day and week have not finished, the high, low and close entries are set to zero for these dates. The FX chart corresponds to the last daily and weekly CSV file entries.

Documents describing the Volatility Response Model (VRM) and the chart format can be found on the first post of this thread.

Predictions for VRM levels of EURGBP and EURUSD and 10 other FX pairs can be found on the website

My current trading strategy is on page #20 post #157 of this thread.
 

Attachments

  • gbpusd.PNG
    gbpusd.PNG
    59.2 KB · Views: 88
  • GBP-USD-DAILY.CSV
    46 KB · Views: 89
  • GBP-USD-WEEKLY.CSV
    46 KB · Views: 72
GBPUSD, EURGBP & EURUSD results for 8th June

Yesterday I attached the predicted support and resistance levels of GBPUSD of the Volatility Response Model (VRM) for today.

EURGBP and EURUSD VRM levels and 10 other FX pairs were on the website

Here are the results for GBPUSD, EURGBP & EURUSD.

Weekly VRM levels in the top 30 minute charts, daily VRM levels in the bottom 30 minute charts. Times are GMT-4 . EMA channel (4,7) included.

GBPUSD began the day with support on daily S1 sentiment level 1.3415

GBPUSD high for the day at daily sentiment level 1.3433

Then falling down to the low for the day at the middle of the short term trend channel at 1.3357

Then bouncing back up to the daily S1 sentiment level 1.3415

There were some large gaps between VRM levels to trade between.
 

Attachments

  • 2018-06-08-GBPUSD-EURGBP-EURUSD-30min.png
    2018-06-08-GBPUSD-EURGBP-EURUSD-30min.png
    668.5 KB · Views: 116
GBPUSD predictions for 11th June

I attach the VRM predictions for GBPUSD for tonight and tomorrow finishing 5 pm 11th June in New York.

The predictions are now in chart format and CSV format for input into charting systems. Predictions are in the column format of date, high, low, close, trend channel top, bottom and middle and 24 dual columns for the VRM levels. The last entry gives today's predictions and this week's predictions. The CSV file also gives past results for the VRM for back testing trading strategies. As the current day and week have not finished, the high, low and close entries are set to zero for these dates. The FX chart corresponds to the last daily and weekly CSV file entries.

Documents describing the Volatility Response Model (VRM) and the chart format can be found on the first post of this thread.

Predictions for VRM levels of EURGBP and EURUSD and 10 other FX pairs can be found on the website

My current trading strategy is on page #20 post #157 of this thread.
 

Attachments

  • gbpusd.PNG
    gbpusd.PNG
    59.4 KB · Views: 93
  • GBP-USD-DAILY.CSV
    46 KB · Views: 82
  • GBP-USD-WEEKLY.CSV
    46 KB · Views: 78
GBPUSD, EURGBP & EURUSD results for 11th June

Yesterday I attached the predicted support and resistance levels of GBPUSD of the Volatility Response Model (VRM) for today.

EURGBP and EURUSD VRM levels and 10 other FX pairs were on the website

Here are the results for GBPUSD, EURGBP & EURUSD.

Weekly VRM levels in the top 1 hour charts, daily VRM levels in the bottom 30 minute charts. Times are GMT-4 . EMA channel (4,7) included.

GBPUSD failed to pull its EMA(4,7) channel through its weekly S1 sentiment level 1.3425 and its high was at the top of the daily sentiment level 1.3445.

GBPUSD low for the day coincided with the EURGBP high for the day at its daily level 0.8832.

EURUSD high for the day was at its daily level 1.1813 and EURUSD was unable to pull its EMA(4,7) through its highest weekly sentiment level 1.1802

There were some large gaps between VRM levels to trade between.
 

Attachments

  • 2018-06-11-GBPUSD-EURGBP-EURUSD-30min.png
    2018-06-11-GBPUSD-EURGBP-EURUSD-30min.png
    525.8 KB · Views: 98
GBPUSD predictions for 12th June

I attach the VRM predictions for GBPUSD for tonight and tomorrow finishing 5 pm 12th June in New York.

The predictions are now in chart format and CSV format for input into charting systems. Predictions are in the column format of date, high, low, close, trend channel top, bottom and middle and 24 dual columns for the VRM levels. The last entry gives today's predictions and this week's predictions. The CSV file also gives past results for the VRM for back testing trading strategies. As the current day and week have not finished, the high, low and close entries are set to zero for these dates. The FX chart corresponds to the last daily and weekly CSV file entries.

Documents describing the Volatility Response Model (VRM) and the chart format can be found on the first post of this thread.

Predictions for VRM levels of EURGBP and EURUSD and 10 other FX pairs can be found on the website

My current trading strategy is on page #20 post #157 of this thread.
 

Attachments

  • GBP-USD-WEEKLY.CSV
    46 KB · Views: 83
  • GBP-USD-DAILY.CSV
    46 KB · Views: 97
  • gbpusd.PNG
    gbpusd.PNG
    59.3 KB · Views: 86
GBPUSD, EURGBP & EURUSD results for 12th June

Yesterday I attached the predicted support and resistance levels of GBPUSD of the Volatility Response Model (VRM) for today.

EURGBP and EURUSD VRM levels and 10 other FX pairs were on the website

Here are the results for GBPUSD, EURGBP & EURUSD.

TWO ATTACHMENTS

FIRST ATTACHMENT

Weekly VRM levels in the top 30 minute charts, daily VRM levels in the bottom 30 minute charts. Times are GMT-4 . EMA channel (4,7) included.

GBPUSD was trapped in the daily sentiment levels today between the highest at 1.3423 and the lowest at 1.3359

EURUSD had a high at the highest weekly sentiment level 1.1807 and a low at the short term trend channel middle at 1.1742. There was an initial bounce at this level at the start of the day.

SECOND ATTACHMENT

Weekly VRM levels in the top 5 minute charts, daily VRM levels in the bottom 5 minute charts. Times are GMT-4 . EMA channel (4,7) included.

Here are the 5 minute charts used for trading starting at 1300 for a 4 hour window using the trading strategy on page #20 post #157 of this thread.. You can see the volatility increase and the retracements happening as the price approaches and passes through some of the VRM levels.

=================================================================

There were some large gaps between VRM levels to trade between.
 

Attachments

  • 2018-06-12-GBPUSD-EURGBP-EURUSD-30min.png
    2018-06-12-GBPUSD-EURGBP-EURUSD-30min.png
    650.4 KB · Views: 81
  • 2018-06-12-GBPUSD-EURGBP-EURUSD-5min-1657.png
    2018-06-12-GBPUSD-EURGBP-EURUSD-5min-1657.png
    586 KB · Views: 103
GBPUSD predictions for 13th June

I attach the VRM predictions for GBPUSD for tonight and tomorrow finishing 5 pm 13th June in New York.

The predictions are now in chart format and CSV format for input into charting systems. Predictions are in the column format of date, high, low, close, trend channel top, bottom and middle and 24 dual columns for the VRM levels. The last entry gives today's predictions and this week's predictions. The CSV file also gives past results for the VRM for back testing trading strategies. As the current day and week have not finished, the high, low and close entries are set to zero for these dates. The FX chart corresponds to the last daily and weekly CSV file entries.

Documents describing the Volatility Response Model (VRM) and the chart format can be found on the first post of this thread.

Predictions for VRM levels of EURGBP and EURUSD and 10 other FX pairs can be found on the website

My current trading strategy is on page #20 post #157 of this thread.
 

Attachments

  • gbpusd.PNG
    gbpusd.PNG
    59.6 KB · Views: 118
  • GBP-USD-DAILY.CSV
    46 KB · Views: 111
  • GBP-USD-WEEKLY.CSV
    46 KB · Views: 83
GBPUSD, EURGBP & EURUSD results for 13th June - Fed Interest Rate Decision

Yesterday I attached the predicted support and resistance levels of GBPUSD of the Volatility Response Model (VRM) for today.

EURGBP and EURUSD VRM levels and 10 other FX pairs were on the website

Here are the results for GBPUSD, EURGBP & EURUSD on Fed Interest Rate Decision day

TWO ATTACHMENTS

FIRST ATTACHMENT

Weekly VRM levels in the top 30 minute charts, daily VRM levels in the bottom 30 minute charts. Times are GMT-4 . EMA channel (4,7) included.

GBPUSD low for the day at daily level 1.3308. High for the day at daily sentiment level 1.3391

At the Fed Interest Rate Decision GBPUSD followed EURUSD as EURUSD made its daily low at daily sentiment level 1.1726 and its daily high at weekly sentiment level 1.1802.

SECOND ATTACHMENT

Weekly VRM levels in the top 5 minute charts, daily VRM levels in the bottom 5 minute charts. Times are GMT-4 . EMA channel (4,7) included. About the Fed Interest Rate Decision.

These charts show in moire detail GBPUSD following EURUSD.

There were some large gaps between VRM levels to trade between.
 

Attachments

  • 2018-06-13-GBPUSD-EURGBP-EURUSD-30min.png
    2018-06-13-GBPUSD-EURGBP-EURUSD-30min.png
    553.2 KB · Views: 89
  • 2018-06-13-GBPUSD-EURGBP-EURUSD-5min-1725.png
    2018-06-13-GBPUSD-EURGBP-EURUSD-5min-1725.png
    489.4 KB · Views: 96
Top