Predicting future FX support and resistance levels using mathematics

GBPUSD predictions for 30th April

I attach the VRM predictions for GBPUSD for tonight and tomorrow finishing 5 pm 30th April in New York.

The predictions are now in chart format and CSV format for input into charting systems. Predictions are in the column format of date, high, low, close, trend channel top, bottom and middle and 24 dual columns for the VRM levels. The last entry gives today's predictions and this week's predictions. The CSV file also gives past results for the VRM for back testing trading strategies. As the current day and week have not finished, the high, low and close entries are set to zero for these dates. The FX chart corresponds to the last daily and weekly CSV file entries.

Documents describing the Volatility Response Model (VRM) and the chart format can be found on the first post of this thread.

Predictions for VRM levels of EURGBP and EURUSD and 10 other FX pairs can be found at

https://www.complexhamiltoniansystems.com/fxcharts/

My current trading strategy is on page #20 post #157 of this thread.
 

Attachments

  • gbpusd.PNG
    gbpusd.PNG
    59.9 KB · Views: 105
  • GBP-USD-DAILY.CSV
    46 KB · Views: 131
  • GBP-USD-WEEKLY.CSV
    46 KB · Views: 127
GBPUSD, EURGBP & EURUSD results for 30th April

Yesterday I attached the predicted support and resistance levels of GBPUSD of the Volatility Response Model (VRM) for today.

EURGBP and EURUSD VRM levels and 10 other FX pairs were on the website

https://www.complexhamiltoniansystems.com/fxcharts/

Here are the results for GBPUSD, EURGBP & EURUSD. TWO ATTACHMENTS

FIRST ATTACHMENT

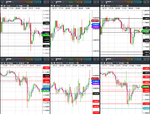
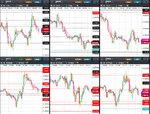
Weekly VRM levels in the top 30 minute charts, daily VRM levels in the bottom 30 minute charts. Times are GMT-4 . EMA channel (4,7) included.

Today the GBPUSD found support on weekly sentiment level 1.3772 and then sold off down to the bottom of the long term trend channel at 1.3715 which was also a daily level and then bounced upwards. Bounces are common at a trend channel top, middle and bottom. The GBPUSD has now traversed top to bottom of the long term trend channel since 17th April.

SECOND ATTACHMENT

Weekly VRM levels in the top 10 minute charts, daily VRM levels in the bottom 10 minute charts. Times are GMT-4 . EMA channel (4,7) included.

Shows in more detail the GBPUSD bounce off the level 1.3715

There were some large gaps between VRM levels to trade between.
 

Attachments

  • 2018-04-30-GBPUSD-EURGBP-EURUSD-30min.png
    2018-04-30-GBPUSD-EURGBP-EURUSD-30min.png
    379.4 KB · Views: 91
  • 2018-04-30-GBPUSD-EURGBP-EURUSD-10min-1505.png
    2018-04-30-GBPUSD-EURGBP-EURUSD-10min-1505.png
    445.4 KB · Views: 165
GBPUSD predictions for 1st May

I attach the VRM predictions for GBPUSD for tonight and tomorrow finishing 5 pm 1st May in New York.

The predictions are now in chart format and CSV format for input into charting systems. Predictions are in the column format of date, high, low, close, trend channel top, bottom and middle and 24 dual columns for the VRM levels. The last entry gives today's predictions and this week's predictions. The CSV file also gives past results for the VRM for back testing trading strategies. As the current day and week have not finished, the high, low and close entries are set to zero for these dates. The FX chart corresponds to the last daily and weekly CSV file entries.

Documents describing the Volatility Response Model (VRM) and the chart format can be found on the first post of this thread.

Predictions for VRM levels of EURGBP and EURUSD and 10 other FX pairs can be found at

https://www.complexhamiltoniansystems.com/fxcharts/

My current trading strategy is on page #20 post #157 of this thread.
 

Attachments

  • GBP-USD-WEEKLY.CSV
    46 KB · Views: 107
  • GBP-USD-DAILY.CSV
    46 KB · Views: 119
  • gbpusd.PNG
    gbpusd.PNG
    59.9 KB · Views: 128
GBPUSD, EURGBP & EURUSD results for 1st May

Yesterday I attached the predicted support and resistance levels of GBPUSD of the Volatility Response Model (VRM) for today.

EURGBP and EURUSD VRM levels and 10 other FX pairs were on the website

https://www.complexhamiltoniansystems.com/fxcharts/

Here are the results for GBPUSD, EURGBP & EURUSD.

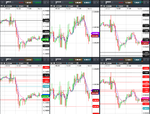
Weekly VRM levels in the top 1 hour charts, daily VRM levels in the bottom 30 minute charts. Times are GMT-4 . EMA channel (4,7) included.

GBPUSD high for the day was at weekly sentiment level 1.3772.

The GBPUSD sold off down to daily level 1.3590 before finding support.

There were some large gaps between VRM levels to trade between.
 

Attachments

  • 2018-05-01-GBPUSD-EURGBP-EURUSD-1hr-30min.png
    2018-05-01-GBPUSD-EURGBP-EURUSD-1hr-30min.png
    237.3 KB · Views: 99
GBPUSD predictions for 2nd May

I attach the VRM predictions for GBPUSD for tonight and tomorrow finishing 5 pm 2nd May in New York.

The predictions are now in chart format and CSV format for input into charting systems. Predictions are in the column format of date, high, low, close, trend channel top, bottom and middle and 24 dual columns for the VRM levels. The last entry gives today's predictions and this week's predictions. The CSV file also gives past results for the VRM for back testing trading strategies. As the current day and week have not finished, the high, low and close entries are set to zero for these dates. The FX chart corresponds to the last daily and weekly CSV file entries.

Documents describing the Volatility Response Model (VRM) and the chart format can be found on the first post of this thread.

Predictions for VRM levels of EURGBP and EURUSD and 10 other FX pairs can be found at

https://www.complexhamiltoniansystems.com/fxcharts/

My current trading strategy is on page #20 post #157 of this thread.
 

Attachments

  • GBP-USD-WEEKLY.CSV
    46 KB · Views: 108
  • GBP-USD-DAILY.CSV
    46 KB · Views: 124
  • gbpusd.PNG
    gbpusd.PNG
    59.7 KB · Views: 98
GBPUSD, EURGBP & EURUSD results for 2th May

Yesterday I attached the predicted support and resistance levels of GBPUSD of the Volatility Response Model (VRM) for today.

EURGBP and EURUSD VRM levels and 10 other FX pairs were on the website

https://www.complexhamiltoniansystems.com/fxcharts/

Here are the results for GBPUSD, EURGBP & EURUSD.

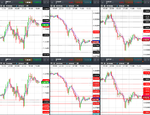
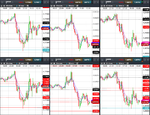
Weekly VRM levels in the top 30 minute charts, daily VRM levels in the bottom 30 minute charts. Times are GMT-4 . EMA channel (4,7) included.

Today the GBPUSD sold off down to the lowest daily sentiment level at 1.3580 before rallying to the highest daily sentiment level 1.3668.

The GBPUSD was unable to stay inside the daily short term trend channel (bottom 1.3642) and fell to daily sentiment level 1.3591 before the FED interest rate decision.

A bounce off the bottom of the short term trend channel at 1.3642 followed.

Before falling to the weekly level 1.3566.

There were some large gaps between VRM levels to trade between.
 

Attachments

  • 2018-05-02-GBPUSD-EURGBP-EURUSD-30min.png
    2018-05-02-GBPUSD-EURGBP-EURUSD-30min.png
    310.8 KB · Views: 80
GBPUSD predictions for 3rd May

I attach the VRM predictions for GBPUSD for tonight and tomorrow finishing 5 pm 3rd May in New York.

The predictions are now in chart format and CSV format for input into charting systems. Predictions are in the column format of date, high, low, close, trend channel top, bottom and middle and 24 dual columns for the VRM levels. The last entry gives today's predictions and this week's predictions. The CSV file also gives past results for the VRM for back testing trading strategies. As the current day and week have not finished, the high, low and close entries are set to zero for these dates. The FX chart corresponds to the last daily and weekly CSV file entries.

Documents describing the Volatility Response Model (VRM) and the chart format can be found on the first post of this thread.

Predictions for VRM levels of EURGBP and EURUSD and 10 other FX pairs can be found at

https://www.complexhamiltoniansystems.com/fxcharts/

My current trading strategy is on page #20 post #157 of this thread.
 

Attachments

  • gbpusd.PNG
    gbpusd.PNG
    59.7 KB · Views: 102
  • GBP-USD-DAILY.CSV
    46 KB · Views: 113
  • GBP-USD-WEEKLY.CSV
    46 KB · Views: 88
GBPUSD, EURGBP & EURUSD results for 3rd May

Yesterday I attached the predicted support and resistance levels of GBPUSD of the Volatility Response Model (VRM) for today.

EURGBP and EURUSD VRM levels and 10 other FX pairs were on the website

https://www.complexhamiltoniansystems.com/fxcharts/

Here are the results for GBPUSD, EURGBP & EURUSD.

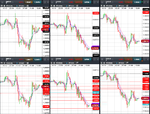
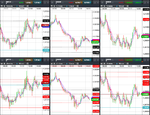
Weekly VRM levels in the top 30 minute charts, daily VRM levels in the bottom 30 minute charts. Times are GMT-4 . EMA channel (4,7) included.

GBPUSD high for the day at weekly level 1.3633

GBPUSD low for the day at weekly level 1.3538 which was also the lowest daily sentiment level.

There were some large gaps between VRM levels to trade between.
 

Attachments

  • 2018-05-03-GBPUSD-EURGBP-EURUSD-30min.png
    2018-05-03-GBPUSD-EURGBP-EURUSD-30min.png
    427 KB · Views: 140
GBPUSD predictions for 4th May

I attach the VRM predictions for GBPUSD for tonight and tomorrow finishing 5 pm 4th May in New York.

The predictions are now in chart format and CSV format for input into charting systems. Predictions are in the column format of date, high, low, close, trend channel top, bottom and middle and 24 dual columns for the VRM levels. The last entry gives today's predictions and this week's predictions. The CSV file also gives past results for the VRM for back testing trading strategies. As the current day and week have not finished, the high, low and close entries are set to zero for these dates. The FX chart corresponds to the last daily and weekly CSV file entries.

Documents describing the Volatility Response Model (VRM) and the chart format can be found on the first post of this thread.

Predictions for VRM levels of EURGBP and EURUSD and 10 other FX pairs can be found at

https://www.complexhamiltoniansystems.com/fxcharts/

My current trading strategy is on page #20 post #157 of this thread.
 

Attachments

  • GBP-USD-WEEKLY.CSV
    46 KB · Views: 105
  • GBP-USD-DAILY.CSV
    46 KB · Views: 119
  • gbpusd.PNG
    gbpusd.PNG
    59.8 KB · Views: 110
GBPUSD, EURGBP & EURUSD results for 4th May - Non Farm Payroll

Yesterday I attached the predicted support and resistance levels of GBPUSD of the Volatility Response Model (VRM) for today.

EURGBP and EURUSD VRM levels and 10 other FX pairs were on the website

https://www.complexhamiltoniansystems.com/fxcharts/

Here are the results for GBPUSD, EURGBP & EURUSD.

TWO ATTACHMENTS

FIRST ATTACHMENT

Weekly VRM levels in the top 1 hour charts, daily VRM levels in the bottom 30 minute charts. Times are GMT-4 . EMA channel (4,7) included.

GBPUSD fell to the short term trend channel bottom at 1.3543 before retracing back to the weekly level 1.3566 prior to the Non Farm Payroll (NFP). The GBPUSD was always bearish below 1.3566 and the daily S1 sentiment level 1.3572 prior to the NFP

At 10 am (GMT-4) the GBPUSD and EURUSD fell rapidly. EURUSD fell to the bottom of its short term trend channel at 1.1911 and then retraced. I have the EURUSD low for the day at 1.19103. GBPUSD was following EURUSD and hence retraced at the same time.

SECOND ATTACHMENT

Weekly VRM levels in the top 5 minute charts, daily VRM levels in the bottom 5 minute charts. Times are GMT-4 . EMA channel (4,7) included.

Shows the price action with 5 minute candlesticks about the NFP.

The EURUSD can be seen bouncing about its daily sentiment levels on the NFP announcement then falling to 1.1911. The GBPUSD can be seen following the EURUSD. Selling GBPUSD and EURUSD at 10:05 (GMT-4) follows the trading strategy on page #20 post #157 of this thread.

There were some large gaps between VRM levels to trade between.
 

Attachments

  • 2018-05-04-GBPUSD-EURGBP-EURUSD-1hr-30min-NonFarmPayroll.png
    2018-05-04-GBPUSD-EURGBP-EURUSD-1hr-30min-NonFarmPayroll.png
    348.6 KB · Views: 82
  • 2018-05-04-GBPUSD-EURGBP-EURUSD-5min-NonFarmPayroll-1220.png
    2018-05-04-GBPUSD-EURGBP-EURUSD-5min-NonFarmPayroll-1220.png
    306.2 KB · Views: 124
GBPUSD predictions for 7th May

I attach the VRM predictions for GBPUSD for tonight and tomorrow finishing 5 pm 7th May in New York.

The predictions are now in chart format and CSV format for input into charting systems. Predictions are in the column format of date, high, low, close, trend channel top, bottom and middle and 24 dual columns for the VRM levels. The last entry gives today's predictions and this week's predictions. The CSV file also gives past results for the VRM for back testing trading strategies. As the current day and week have not finished, the high, low and close entries are set to zero for these dates. The FX chart corresponds to the last daily and weekly CSV file entries.

Documents describing the Volatility Response Model (VRM) and the chart format can be found on the first post of this thread.

Predictions for VRM levels of EURGBP and EURUSD and 10 other FX pairs can be found at

https://www.complexhamiltoniansystems.com/fxcharts/

My current trading strategy is on page #20 post #157 of this thread.
 

Attachments

  • gbpusd.PNG
    gbpusd.PNG
    59.5 KB · Views: 85
  • GBP-USD-DAILY.CSV
    46 KB · Views: 120
  • GBP-USD-WEEKLY.CSV
    46 KB · Views: 108
I attach the VRM predictions for GBPUSD for tonight and tomorrow finishing 5 pm 7th May in New York.

The predictions are now in chart format and CSV format for input into charting systems. Predictions are in the column format of date, high, low, close, trend channel top, bottom and middle and 24 dual columns for the VRM levels. The last entry gives today's predictions and this week's predictions. The CSV file also gives past results for the VRM for back testing trading strategies. As the current day and week have not finished, the high, low and close entries are set to zero for these dates. The FX chart corresponds to the last daily and weekly CSV file entries.

Documents describing the Volatility Response Model (VRM) and the chart format can be found on the first post of this thread.

Predictions for VRM levels of EURGBP and EURUSD and 10 other FX pairs can be found at

https://www.complexhamiltoniansystems.com/fxcharts/

My current trading strategy is on page #20 post #157 of this thread.

These posts are now generated by the VRM posting bot.
A clever bit of programming indeed :cool:
Pointless VRM levels can now be shared on a regular basis with no human intervention.
 
GBPUSD, EURGBP & EURUSD results for 7th May

Yesterday I attached the predicted support and resistance levels of GBPUSD of the Volatility Response Model (VRM) for today.

EURGBP and EURUSD VRM levels and 10 other FX pairs were on the website

https://www.complexhamiltoniansystems.com/fxcharts/

Here are the results for GBPUSD, EURGBP & EURUSD.

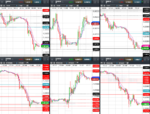
Weekly VRM levels in the top 30 minute charts, daily VRM levels in the bottom 30 minute charts. Times are GMT-4 . EMA channel (4,7) included.

Today the GBPUSD was trapped in between daily and weekly sentiment levels. Low for the day was daily sentiment level 1.3516 and high for the day was about the weekly sentiment level 1.3564. GBPUSD was neither fully bullish or bearish.

There were some large gaps between VRM levels to trade between
 

Attachments

  • 2018-05-07-GBPUSD-EURGBP-EURUSD-30min.png
    2018-05-07-GBPUSD-EURGBP-EURUSD-30min.png
    399.9 KB · Views: 98
GBPUSD predictions for 8th May

I attach the VRM predictions for GBPUSD for tonight and tomorrow finishing 5 pm 8th May in New York.

The predictions are now in chart format and CSV format for input into charting systems. Predictions are in the column format of date, high, low, close, trend channel top, bottom and middle and 24 dual columns for the VRM levels. The last entry gives today's predictions and this week's predictions. The CSV file also gives past results for the VRM for back testing trading strategies. As the current day and week have not finished, the high, low and close entries are set to zero for these dates. The FX chart corresponds to the last daily and weekly CSV file entries.

Documents describing the Volatility Response Model (VRM) and the chart format can be found on the first post of this thread.

Predictions for VRM levels of EURGBP and EURUSD and 10 other FX pairs can be found at

https://www.complexhamiltoniansystems.com/fxcharts/

My current trading strategy is on page #20 post #157 of this thread.
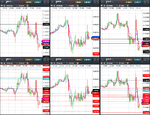
 

Attachments

  • GBP-USD-WEEKLY.CSV
    46 KB · Views: 95
  • GBP-USD-DAILY.CSV
    46 KB · Views: 100
  • gbpusd.PNG
    gbpusd.PNG
    59.8 KB · Views: 86
GBPUSD, EURGBP & EURUSD results for 8th May

Yesterday I attached the predicted support and resistance levels of GBPUSD of the Volatility Response Model (VRM) for today.

EURGBP and EURUSD VRM levels and 10 other FX pairs were on the website

https://www.complexhamiltoniansystems.com/fxcharts/

Here are the results for GBPUSD, EURGBP & EURUSD.

Weekly VRM levels in the top 30 minute charts, daily VRM levels in the bottom 30 minute charts. Times are GMT-4 . EMA channel (4,7) included.

Today GBPUSD and EURGBP coordinated at 3 am . GBPUSD rallied to weekly sentiment level 1.3583 and EURGBP fell to its short term trend channel middle 0.8777.

From GBPUSD`s high it fell with EURUSD. GBPUSD fell to its low at daily level 1.3489. EURUSD fell to its low at its short term trend channel bottom 1.1849.

There were some large gaps between VRM levels to trade between.
 

Attachments

  • 2018-05-08-GBPUSD-EURGBP-EURUSD-30min.png
    2018-05-08-GBPUSD-EURGBP-EURUSD-30min.png
    405 KB · Views: 128
GBPUSD predictions for 9th May

I attach the VRM predictions for GBPUSD for tonight and tomorrow finishing 5 pm 9th May in New York.

The predictions are now in chart format and CSV format for input into charting systems. Predictions are in the column format of date, high, low, close, trend channel top, bottom and middle and 24 dual columns for the VRM levels. The last entry gives today's predictions and this week's predictions. The CSV file also gives past results for the VRM for back testing trading strategies. As the current day and week have not finished, the high, low and close entries are set to zero for these dates. The FX chart corresponds to the last daily and weekly CSV file entries.

Documents describing the Volatility Response Model (VRM) and the chart format can be found on the first post of this thread.

Predictions for VRM levels of EURGBP and EURUSD and 10 other FX pairs can be found at

https://www.complexhamiltoniansystems.com/fxcharts/

My current trading strategy is on page #20 post #157 of this thread.
 

Attachments

  • gbpusd.PNG
    gbpusd.PNG
    59.9 KB · Views: 81
  • GBP-USD-DAILY.CSV
    46 KB · Views: 99
  • GBP-USD-WEEKLY.CSV
    46 KB · Views: 110
GBPUSD, EURGBP & EURUSD results for 9th May

Yesterday I attached the predicted support and resistance levels of GBPUSD of the Volatility Response Model (VRM) for today.

EURGBP and EURUSD VRM levels and 10 other FX pairs were on the website

https://www.complexhamiltoniansystems.com/fxcharts/

Here are the results for GBPUSD, EURGBP & EURUSD.

Weekly VRM levels in the top 1 hour charts, daily VRM levels in the bottom 30 minute charts. Times are GMT-4 . EMA channel (4,7) included.

Today the GBPUSD weekly S1 sentiment level 1.3555 featured twice during the day. Initially GBPUSD fell from 1.3555 with EURUSD and made its low when EURUSD bounced off the bottom of its short term trend channel bottom at 1.1821.

GBPUSD then rallied to its daily high level at 1.3603 and EURUSD rallied to its highest daily sentiment level 1.1887.

GBPUSD then fell down to weekly S1 sentiment level 1.3555 where it stayed supported for at least 2 hours.

There were some large gaps between VRM levels to trade between.
 

Attachments

  • 2018-05-09-GBPUSD-EURGBP-EURUSD-1hr-30min.png
    2018-05-09-GBPUSD-EURGBP-EURUSD-1hr-30min.png
    367 KB · Views: 75
GBPUSD predictions for 10th May

I attach the VRM predictions for GBPUSD for tonight and tomorrow finishing 5 pm 10th May in New York.

The predictions are now in chart format and CSV format for input into charting systems. Predictions are in the column format of date, high, low, close, trend channel top, bottom and middle and 24 dual columns for the VRM levels. The last entry gives today's predictions and this week's predictions. The CSV file also gives past results for the VRM for back testing trading strategies. As the current day and week have not finished, the high, low and close entries are set to zero for these dates. The FX chart corresponds to the last daily and weekly CSV file entries.

Documents describing the Volatility Response Model (VRM) and the chart format can be found on the first post of this thread.

Predictions for VRM levels of EURGBP and EURUSD and 10 other FX pairs can be found at

https://www.complexhamiltoniansystems.com/fxcharts/

My current trading strategy is on page #20 post #157 of this thread.
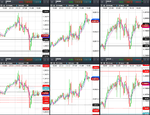
 

Attachments

  • gbpusd.PNG
    gbpusd.PNG
    60.1 KB · Views: 85
  • GBP-USD-DAILY.CSV
    46 KB · Views: 94
  • GBP-USD-WEEKLY.CSV
    46 KB · Views: 95
Top