Predicting future FX support and resistance levels using mathematics

GBPUSD, EURGBP & EURUSD results for 13th April

Yesterday I attached the predicted support and resistance levels of GBPUSD of the Volatility Response Model (VRM) for today.

EURGBP and EURUSD VRM levels and 10 other FX pairs were on the website

https://www.complexhamiltoniansystems.com/fxcharts/

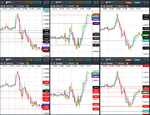
Here are the results for GBPUSD, EURGBP & EURUSD.

Weekly VRM levels in the top 30 minute charts, daily VRM levels in the bottom 30 minute charts. Times are GMT-4 . EMA channel (4,7) included.

Today the GBPUSD had support at the daily sentiment level 1.4228 and then bounced up to weekly level 1.4298 which was also a daily level today.

Remember that the weekly level 1.4298 was calculated last weekend using weekly high/low/close data and the daily level 1.4298 was calculated using last nights high/low/close. Two different data sets gave the same level.

EURUSD again bounced off its short term trend channel middle at 1.2309

There were some large gaps between VRM levels to trade between.
 

Attachments

  • 2018-04-13-GBPUSD-EURGBP-EURUSD-30min.png
    2018-04-13-GBPUSD-EURGBP-EURUSD-30min.png
    377.9 KB · Views: 108
Yesterday I attached the predicted support and resistance levels of GBPUSD of the Volatility Response Model (VRM) for today.

EURGBP and EURUSD VRM levels and 10 other FX pairs were on the website

https://www.complexhamiltoniansystems.com/fxcharts/

Here are the results for GBPUSD, EURGBP & EURUSD.

Weekly VRM levels in the top 30 minute charts, daily VRM levels in the bottom 30 minute charts. Times are GMT-4 . EMA channel (4,7) included.

Today the GBPUSD had support at the daily sentiment level 1.4228 and then bounced up to weekly level 1.4298 which was also a daily level today.

Remember that the weekly level 1.4298 was calculated last weekend using weekly high/low/close data and the daily level 1.4298 was calculated using last nights high/low/close. Two different data sets gave the same level.

EURUSD again bounced off its short term trend channel middle at 1.2309

There were some large gaps between VRM levels to trade between.
Open up the chart, draw a few horizontal lines, and you'll get similar results i.e. lines on the chart (y)
 
So today the GBPUSD sold off down to the bottom bollinger band and took out the lows as predicted by my eyes and VRM mouse, then bounced up to the upper band...

75n7y


:clap:

You really don't understand do you Kaeso. Your Bollinger Bands were created in real time using 30 minute candlestick charts yesterday. The weekly VRM levels were created last weekend. The levels were created last weekend !. Do you understand the significance of that Kaeso. I don't think so.
 
You really don't understand do you Kaeso. Your Bollinger Bands were created in real time using 30 minute candlestick charts yesterday. The weekly VRM levels were created last weekend. The levels were created last weekend !. Do you understand the significance of that Kaeso. I don't think so.

i understand the insignificance of the lines you generated last weekend
 
GBPUSD weekly VRM levels 30 minute charts ending 13th April

i understand the insignificance of the lines you generated last weekend

I attach the 30 minute GBPUSD chart for the whole of last week with the weekly VRM levels and EMA channel (4,7) included.

Kaeso seems to think that the weekly VRM levels 1.4111, 1.4136, 1.4149, 1.4154. 1.4188, 1.4225, 1.4244 and 1.4298 calculated in advance last weekend before the NY open on Sunday are insignificant. I let the viewer decide.
 

Attachments

  • 2018-04-13-GBPUSD-30min-weekly-levels-1-week.png
    2018-04-13-GBPUSD-30min-weekly-levels-1-week.png
    166.9 KB · Views: 109
GBPUSD predictions for 16th April

I attach the VRM predictions for GBPUSD for tonight and tomorrow finishing 5 pm 16th April in New York.

The predictions are now in chart format and CSV format for input into charting systems. Predictions are in the column format of date, high, low, close, trend channel top, bottom and middle and 24 dual columns for the VRM levels. The last entry gives today's predictions and this week's predictions. The CSV file also gives past results for the VRM for back testing trading strategies. As the current day and week have not finished, the high, low and close entries are set to zero for these dates. The FX chart corresponds to the last daily and weekly CSV file entries.

Documents describing the Volatility Response Model (VRM) and the chart format can be found on the first post of this thread.

Predictions for VRM levels of EURGBP and EURUSD and 10 other FX pairs can be found at

https://www.complexhamiltoniansystems.com/fxcharts/

My current trading strategy is on page #20 post #157 of this thread.
 

Attachments

  • gbpusd.PNG
    gbpusd.PNG
    58.1 KB · Views: 118
  • GBP-USD-DAILY.CSV
    46 KB · Views: 123
  • GBP-USD-WEEKLY.CSV
    46 KB · Views: 124
Kaeso seems to think that the weekly VRM levels 1.4111, 1.4136, 1.4149, 1.4154. 1.4188, 1.4225, 1.4244 and 1.4298 calculated in advance last weekend before the NY open on Sunday are insignificant. I let the viewer decide.

the viewers have decided that if you throw 24 lines on the chart, price is bound hit them a few times
 
GBPUSD, EURGBP & EURUSD results for 16th April

Yesterday I attached the predicted support and resistance levels of GBPUSD of the Volatility Response Model (VRM) for today.

EURGBP and EURUSD VRM levels and 10 other FX pairs were on the website

https://www.complexhamiltoniansystems.com/fxcharts/

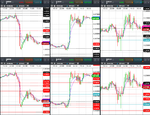
Here are the results for GBPUSD, EURGBP & EURUSD.

Weekly VRM levels in the top 1 hour charts, daily VRM levels in the bottom 30 minute charts. Times are GMT-4 . EMA channel (4,7) included.

Today the GBPUSD found support on the weekly S1 sentiment level 1.4250

Then rose to the highest weekly sentiment level 1.4334. (Also daily level 1.4332) Where it spent at least 6 hours trying to break through.

Retracements can be seen at the daily levels 1.4311, 1.4323 and 1.4332

There were some large gaps between VRM levels to trade between.
 

Attachments

  • 2018-04-16-GBPUSD-EURGBP-EURUSD-1hr-30min.png
    2018-04-16-GBPUSD-EURGBP-EURUSD-1hr-30min.png
    370.6 KB · Views: 86
GBPUSD predictions for 17th April

I attach the VRM predictions for GBPUSD for tonight and tomorrow finishing 5 pm 17th April in New York.

The predictions are now in chart format and CSV format for input into charting systems. Predictions are in the column format of date, high, low, close, trend channel top, bottom and middle and 24 dual columns for the VRM levels. The last entry gives today's predictions and this week's predictions. The CSV file also gives past results for the VRM for back testing trading strategies. As the current day and week have not finished, the high, low and close entries are set to zero for these dates. The FX chart corresponds to the last daily and weekly CSV file entries.

Documents describing the Volatility Response Model (VRM) and the chart format can be found on the first post of this thread.

Predictions for VRM levels of EURGBP and EURUSD and 10 other FX pairs can be found at

https://www.complexhamiltoniansystems.com/fxcharts/

My current trading strategy is on page #20 post #157 of this thread.
 

Attachments

  • gbpusd.PNG
    gbpusd.PNG
    57.7 KB · Views: 131
  • GBP-USD-DAILY.CSV
    46 KB · Views: 127
  • GBP-USD-WEEKLY.CSV
    46 KB · Views: 116
Kaeso seems to think that the weekly VRM levels 1.4111, 1.4136, 1.4149, 1.4154. 1.4188, 1.4225, 1.4244 and 1.4298 calculated in advance last weekend before the NY open on Sunday are insignificant. I let the viewer decide.

Traders are in the trading business and not prediction business. Imagine if you are in the time keeping business and you have 24 clocks all telling you a different time, which one do you rely on to do your job?

You have to put on the hat of the trader or else we might as well be speaking to each other in Klingon. The most basic tenet if you are in the trading business is to address the trader's equation. The trader's equation is simply a set of factors used in the determination of whether a trade level will provide sufficient justification of RR given its perceived probability. It is improbable that a trader is able to make such a determination when given 24 levels to consider regardless of whether there is sufficient certainty that one or more level will prove to be useful after the fact. It is a point that many of us has been trying to get across to you but unfortunately without much success.

If you know of a way then show us how you are able to capitalise on your prediction levels to trade them. Please don't hide behind the veil that you don't have access to intra day data. You merely need to open a demo account from a choice of multitude of brokers out there and trade those prediction levels as you have kindly shared with us. When you have to make choices over your 24 levels in executing your trade decisions, maybe then the issue can become more obvious.
 
I attach the 30 minute GBPUSD chart for the whole of last week with the weekly VRM levels and EMA channel (4,7) included.

Kaeso seems to think that the weekly VRM levels 1.4111, 1.4136, 1.4149, 1.4154. 1.4188, 1.4225, 1.4244 and 1.4298 calculated in advance last weekend before the NY open on Sunday are insignificant. I let the viewer decide.

Please find attached my chart of GBPUSD for the period 9th - 13th April 2018. I have overlaid my proprietary 'Spectrum Levels' which, I am sure you'll agree, are also highly significant. I'll let the viewer decide who's are more significant and why.
 

Attachments

  • Spectrum.JPG
    Spectrum.JPG
    159.6 KB · Views: 113
Traders are in the trading business and not prediction business. Imagine if you are in the time keeping business and you have 24 clocks all telling you a different time, which one do you rely on to do your job?

You have to put on the hat of the trader or else we might as well be speaking to each other in Klingon. The most basic tenet if you are in the trading business is to address the trader's equation. The trader's equation is simply a set of factors used in the determination of whether a trade level will provide sufficient justification of RR given its perceived probability. It is improbable that a trader is able to make such a determination when given 24 levels to consider regardless of whether there is sufficient certainty that one or more level will prove to be useful after the fact. It is a point that many of us has been trying to get across to you but unfortunately without much success.

If you know of a way then show us how you are able to capitalise on your prediction levels to trade them. Please don't hide behind the veil that you don't have access to intra day data. You merely need to open a demo account from a choice of multitude of brokers out there and trade those prediction levels as you have kindly shared with us. When you have to make choices over your 24 levels in executing your trade decisions, maybe then the issue can become more obvious.

Hi Brumby

Thank you for your point of view.

My current trading strategy is on page #20 post #157 of this thread. The chart that you quoted shows lots of opportunities to trade between the weekly VRM levels using the 5 minute EMA(4,7) channel to asses a pass through or bounce off a level. This trading strategy requires a lot of screen time. When I trade this way then at most 3 hours is all I can take. Call it scalping between VRM levels with larger pip size profit. I hide my stop loss behind a VRM level and make a T/P at the next VRM level. Look for large gaps for reward to asses your risk/reward.

As I am replying to your point of view I do not know how you trade. If you are a channel trader willing to go hugely negative before achieving your even larger reward then I suggest you use the VRM short term and long term trend channels instead. The channels (or wedges) I see on trade2win use straight lines. The VRM trend channels bend and twist. You will see from the charts I attach each night that when the GBPUSD is bullish then it moves top side of the middle of a trend channel. And visa-versa for bearish. The price action also bounces off the top, middle and bottom of trend channels.

On the 9th April buying the GBPUSD was optimal. It had just bounced off the middle of the long term trend channel middle and passed through the middle of the short term trend channel. At the open Sunday 8th place a buy. With the S/L hiding the other side of the short term trend channel middle and the T/P at the top of the short term trend channel.

The charts each night list the top, middle, bottom and range (top to bottom) of a trend channel. So today the figures for GBPUSD are 1.4346, 1.4157, 1.3968 and 377 pips for the short term trend channel. When you make your trade check out that you are not facing a VRM level. I suggest trades close to the trend channel top, middle or bottom. Anywhere else and you could get hundreds of pips of sudden movement.

Each night check to see if you have reached your T/P. If not then there will be more profit to take as the next day's trend channel has moved on. Adjust your T/P accordingly.

I think the T/P should be padded out from the trend channel side because when markets move rapidly then the spread can increase and you might not close the trade.
 
Please find attached my chart of GBPUSD for the period 9th - 13th April 2018. I have overlaid my proprietary 'Spectrum Levels' which, I am sure you'll agree, are also highly significant. I'll let the viewer decide who's are more significant and why.

Hi cbrads thank you for sharing your proprietary Spectrum Levels. Your levels are in steps of 50 pips. I compared your chart levels with the VRM levels and I think the VRM levels are more accurate. Perhaps you can fine tune your levels with the VRM levels.
 
I suggest you use the VRM short term and long term trend channels instead.

When you make your trade check out that you are not facing a VRM level. I suggest trades close to the trend channel top, middle or bottom. Anywhere else and you could get hundreds of pips of sudden movement.

Each night check to see if you have reached your T/P. If not then there will be more profit to take as the next day's trend channel has moved on. Adjust your T/P accordingly.

I think the T/P should be padded out from the trend channel side because when markets move rapidly then the spread can increase and you might not close the trade.

Deluded alert!
Of course Brumby is going to start trading your random levels and disregard his current method :whistling
This is definitely going to happen :rolleyes:
 
Please find attached my chart of GBPUSD for the period 9th - 13th April 2018. I have overlaid my proprietary 'Spectrum Levels' which, I am sure you'll agree, are also highly significant. I'll let the viewer decide who's are more significant and why.

Actually the VRM levels are looking a lot more significant on this one gka..

oh sorry they are ermm spectrum levels, thanks cbrads :cheesy:
 
GBPUSD, EURGBP & EURUSD results for 17th April

Yesterday I attached the predicted support and resistance levels of GBPUSD of the Volatility Response Model (VRM) for today.

EURGBP and EURUSD VRM levels and 10 other FX pairs were on the website

https://www.complexhamiltoniansystems.com/fxcharts/

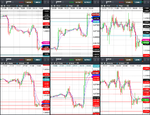
Here are the results for GBPUSD, EURGBP & EURUSD.

Weekly VRM levels in the top 30 minute charts, daily VRM levels in the bottom 30 minute charts. Times are GMT-4 . EMA channel (4,7) included.

Today the GBPUSD began by following EURUSD and made its daily high when EURUSD made its high at weekly VRM level 1.2409.

GBPUSD made its low today at weekly sentiment level 1.4285 / lowest daily sentiment level 1.4283.

There were some large gaps between VRM levels to trade between.
 

Attachments

  • 2018-04-17-GBPUSD-EURGBP-EURUSD-30min.png
    2018-04-17-GBPUSD-EURGBP-EURUSD-30min.png
    316.3 KB · Views: 151
GBPUSD predictions for 18th April

I attach the VRM predictions for GBPUSD for tonight and tomorrow finishing 5 pm 18th April in New York.

The predictions are now in chart format and CSV format for input into charting systems. Predictions are in the column format of date, high, low, close, trend channel top, bottom and middle and 24 dual columns for the VRM levels. The last entry gives today's predictions and this week's predictions. The CSV file also gives past results for the VRM for back testing trading strategies. As the current day and week have not finished, the high, low and close entries are set to zero for these dates. The FX chart corresponds to the last daily and weekly CSV file entries.

Documents describing the Volatility Response Model (VRM) and the chart format can be found on the first post of this thread.

Predictions for VRM levels of EURGBP and EURUSD and 10 other FX pairs can be found at

https://www.complexhamiltoniansystems.com/fxcharts/

My current trading strategy is on page #20 post #157 of this thread.
 

Attachments

  • gbpusd.PNG
    gbpusd.PNG
    58.2 KB · Views: 185
  • GBP-USD-DAILY.CSV
    46 KB · Views: 141
  • GBP-USD-WEEKLY.CSV
    46 KB · Views: 146
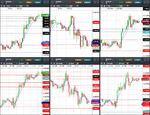
GBPUSD, EURGBP & EURUSD results for 18th April

Yesterday I attached the predicted support and resistance levels of GBPUSD of the Volatility Response Model (VRM) for today.

EURGBP and EURUSD VRM levels and 10 other FX pairs were on the website

https://www.complexhamiltoniansystems.com/fxcharts/

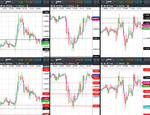
Here are the results for GBPUSD, EURGBP & EURUSD.

Weekly VRM levels in the top 30 minute charts, daily VRM levels in the bottom 30 minute charts. Times are GMT-4 . EMA channel (4,7) included.

GBPUSD high for the day was at weekly sentiment levels 1.4306 and daily S1 sentiment level 1.4306. Weekly and daily data sets calculated the same level.

Then GBPUSD fell to the short term trend channel middle at 1.4189. Bounced back up and failed to break through the daily level 1.4239.

There were some large gaps between VRM levels to trade between.
 

Attachments

  • 2018-04-18-GBPUSD-EURGBP-EURUSD-30min.png
    2018-04-18-GBPUSD-EURGBP-EURUSD-30min.png
    362.4 KB · Views: 191
GBPUSD predictions for 19th April

I attach the VRM predictions for GBPUSD for tonight and tomorrow finishing 5 pm 19th April in New York.

The predictions are now in chart format and CSV format for input into charting systems. Predictions are in the column format of date, high, low, close, trend channel top, bottom and middle and 24 dual columns for the VRM levels. The last entry gives today's predictions and this week's predictions. The CSV file also gives past results for the VRM for back testing trading strategies. As the current day and week have not finished, the high, low and close entries are set to zero for these dates. The FX chart corresponds to the last daily and weekly CSV file entries.

Documents describing the Volatility Response Model (VRM) and the chart format can be found on the first post of this thread.

Predictions for VRM levels of EURGBP and EURUSD and 10 other FX pairs can be found at

https://www.complexhamiltoniansystems.com/fxcharts/

My current trading strategy is on page #20 post #157 of this thread.
 

Attachments

  • gbpusd.PNG
    gbpusd.PNG
    58.7 KB · Views: 176
  • GBP-USD-DAILY.CSV
    46 KB · Views: 130
  • GBP-USD-WEEKLY.CSV
    46 KB · Views: 129
GBPUSD, EURGBP & EURUSD results for 19th April

Yesterday I attached the predicted support and resistance levels of GBPUSD of the Volatility Response Model (VRM) for today.

EURGBP and EURUSD VRM levels and 10 other FX pairs were on the website

https://www.complexhamiltoniansystems.com/fxcharts/

Here are the results for GBPUSD, EURGBP & EURUSD.

Weekly VRM levels in the top 1 hour charts, daily VRM levels in the bottom 30 minute charts. Times are GMT-4 . EMA channel (4,7) included.

GBPUSD high for the day close to weekly S1 sentiment level 1.4250. I guess all the sell orders were waiting there.

GBPUSD unable to pull 1 hour EMA(4,7) channel through lowest weekly sentiment level 1.4228.

GBPUSD sold off down to daily level 1.4068. I have the low for the day as 1.40684.

Note on the nightly chart that the short term trend channel top has now collided with the long term trend channel top.

There were some large gaps between VRM levels to trade between.
 

Attachments

  • 2018-04-19-GBPUSD-EURGBP-EURUSD-1hr-30min.png
    2018-04-19-GBPUSD-EURGBP-EURUSD-1hr-30min.png
    304.9 KB · Views: 167
Top