Best Thread Potential setups

Status
Not open for further replies.
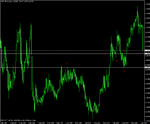
Hi Paul, this was my chart (without ladder thing and green line).

Didnt have any lines marked at 840 either, I originally put an order to sell under the two hourly bars. Just after, I was watching it on Oanda and noticed it `jumping` down from around 840 and figured that was a good place. Then changed my order to a limit sell.... Only just luckily got triggered as well by about 3 cents ! 😎

Got my stop at b/e but might lock in 1:1 now, not sure ................

edit:
Dont know about 820.00, my plan is to leave it until tommorow and see what happens, assuming it doesnt get stopped out!

edit v2:
It got stopped out! at 1:1. Not going to try and put it back on with it being Friday.
 

Attachments

  • h1_gold.gif
    h1_gold.gif
    21.3 KB · Views: 183
Last edited:
Morning guys.

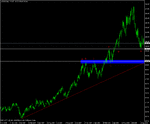
I bought up a 10 year chart on GBP/USD. The price today is exactly on my 38.2% retracement Fib from the low of 2002 to the recent high.

Maybe we'll get a little bounce now?
 
Hi guys

Just started to look at forex and i am only demo trading but thought i would share what i'm doing and get some feedback, mostly trying some support resistance trading. so chart below shows me long on usd/jpy not the best of pin bars but it broke through support and came back up so i pulled the trigger.
 

Attachments

  • usdjpy.gif
    usdjpy.gif
    41.1 KB · Views: 169
Hi Paul I have that level marked as well (199.77), was my first target for the short, marked it with a dotted line because it was only hit from one side(?). A pin has formed on the 1hr chart. Still short myself for now ..........

Hi 1Pipped

I hope the little bounce didn't stop out your short, as it now looks determined to keep on (198.00, 192.63 or possibly January 2004's 190.00)

By the way, where & why did you get in on this one short?

good trading
Paul
 
Hi Paul, this was my chart (without ladder thing and green line).

Didnt have any lines marked at 840 either, I originally put an order to sell under the two hourly bars. Just after, I was watching it on Oanda and noticed it `jumping` down from around 840 and figured that was a good place. Then changed my order to a limit sell.... Only just luckily got triggered as well by about 3 cents ! 😎

Got my stop at b/e but might lock in 1:1 now, not sure ................

edit:
Dont know about 820.00, my plan is to leave it until tommorow and see what happens, assuming it doesnt get stopped out!

edit v2:
It got stopped out! at 1:1. Not going to try and put it back on with it being Friday.

Hi 1Pipped

Thank you for that explanation, I'm still a real novice looking for pins around points where I have marked S/R levels & or trend lines, so wouldn't have appreciated the break below the of those two bars (even if I looked at a 1 hour time frame) and certainly not a 'jumping down'. But it is very good to learn from someone more experienced

Your 1:1 call was very sound given what looks like a continuing daily up trend. A very fast few pips

Paul
 
hi gang,a bit early but im going to get in on this one,unless something drastic happens later today
 

Attachments

  • auscad.gif
    auscad.gif
    39.1 KB · Views: 170
hi gang,a bit early but im going to get in on this one,unless something drastic happens later today

looks like its gonna be a sweeet pin! X marks the spot!

I'll probably look to see if there's a retrace first as the stoploss required is a bit much for my tiny account!
 
Hi Paul,

gbpjpy still in, moved the stop to 200.10 today.

I put the short on, on this 'double high lower close' pair of bars that crossed over a daily level. I didnt think the weekly level just below would be important as it was from 2005/2006, but it was important for just long enough to put the first half of trade out of business! (I put one half with a stop half way up the bar).

Looks like a lot of pips made, but due to first half being taken out its only breaking even at 1:1 so not very good really as of yet...
 

Attachments

  • h4_gbpjpy.gif
    h4_gbpjpy.gif
    13.9 KB · Views: 172
hi gang,a bit early but im going to get in on this one,unless something drastic happens later today

Hi spurs thats a tastey looking pin there, also off this daily pivot and the 0.89 round number. Ill put that on the watchlist 👍
 

Attachments

  • d1_audcad.gif
    d1_audcad.gif
    20.5 KB · Views: 178
hi super,pip.ows ye tradin gwaan??
nice find super,always like your charts.nice daily set up as pip says also,just had a bullish IB break right of your trend line and any continued rise will break the weekly pin AND the 23 % fib of the last swing down.oh yeah nice lookin indicators too😉
first target on my chart is around 92.80 mark and after that 93.80ish which is also the 50% fib.after that 95 looks good.
on the down side we have sup. at 88.90ish if it doesnt take off.👍
just my 2ps worth.will certainly take a long (at the weekly pin break price)if it breaks when im around!!
happy hunting 😛
 

Attachments

  • update.gif
    update.gif
    21.6 KB · Views: 159
Potential Setups

No specific bar setups I am interested in right now but here are the levels that I am watching. See specific charts attached below.

Crude Oil

Crude has certainly found some support at the $110 S/R pivot. The bounce hasn't been strong and I am favouring an eventual break lower to the $100 area where you have the key round number, a beautiful S/R pivot and the weekly TL all converging. This is a great spot to watch for opportunities to get long.

GBP/USD (Cable)

After a sharp and extended move down like this I am looking for logical places for the market to bottom so I can make some profit in the ensuing rally and try and hold some to build a position if its a longer term bottom. The latter is unlikely with the situation in the UK right now but playing for a rally exacerbated by short covering and fresh buying is a good play if the level is right. 1.8000 is a key number and there is S/R zone there so this is the first level to look for price action. Below that there is a whole lot of nothing. Infact I had to go to the monthly charts to find anything meaningful and the best I could come up with is 1.7100 area. Time will tell...

Wheat

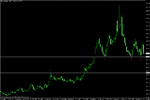
There is huge support on the Wheat. If this goes there is a long way for this market to fall. I am not confident it will break as the commodities markets can channel indefinetly however, all eyes on that level. Last time it came back there, there was an hourly pin to go long that would have got you in literally right at the bottom and would have made you a HUGE amount of money.

Eur/Usd (Euro)

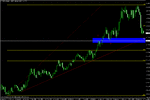
The Euro has a big level around 1.4300. There is a weekly TL, a 38 fib of the whole swing AND a decent S/R pivot all providing a meaningful degree of confluence. That blue box is the area to watch the price action.

Usd/Jpy

This market has been a mess lately and making money intraday has been hard for me because I like to run my positions. I can't count the number of times I've been well onside on a position to see it come all the way back. There is a pivot on the chart at around 1.0850. This may decide the short term course of the market. But be careful with it!!
 

Attachments

  • usd_jpy_daily.gif
    usd_jpy_daily.gif
    20.2 KB · Views: 213
  • euro_weekly.gif
    euro_weekly.gif
    19.7 KB · Views: 236
  • wheat_weekly.gif
    wheat_weekly.gif
    15.9 KB · Views: 221
  • cable_monthly.gif
    cable_monthly.gif
    24.6 KB · Views: 262
  • crude_daily.gif
    crude_daily.gif
    15.3 KB · Views: 229
Anyone out there know why sterling is dropping on the open?
Mr Darling is all i can think of........
 
Nice pinbar forming on usdchf 1 hour chart
 

Attachments

  • usdchf.gif
    usdchf.gif
    39.8 KB · Views: 203
OK, no trading talk today.
What is everyone doing with their day off?
Come on 1pipped, superspurs and co.
What you guys up to?
 
Hi omni,
Im thinking of moving this stop down, not sure though. Then off to work afternoon for a few hours.

What do you think about it.... Im thinking if that gap gets closed the stop where it is (solid green line) will probably get hit anyway so might as well get out at bottom of gap. Looks quite safe as well because the £ looks dead !
 

Attachments

  • h1_gbpjpy.gif
    h1_gbpjpy.gif
    10.2 KB · Views: 203
I moved that stop. Also check usdcad out on the hourly tf. Pin right off an hourly support level, doesnt really line up with anything else apart from being fairly close to 1.06 and a 38% fib. I risk less than 1% in 2 halfs, on this because its not brilliant confluence, but it does look nice!
 
Possible buy at around for pin bar off trend line for 1hr gold chart.(not fully complete yet). Can't provide chart at the moment.
Shane
 
Status
Not open for further replies.
Back
Top