Best Thread Potential setups

Status
Not open for further replies.
Glenborrell that attachment isn't working.

Ljr,

Sorry, tried to copy my charts as per above as previously the only way i've managed to do it was to copy it into word. When i tested it before i loaded it it worked. I'm on Capital spreads. Any pointers to saving their charts?

Glen
 
Should have taken Gold last night when it bounced off resistence. Not sure where the bottom is now, there doesn't seem to be a lot of support, other than the 61.8% Fib it is currently sitting on. I guess that could offer a little support.

The fall of Silver now is unreal!!
 

Attachments

  • Daily Spot Gold (14-AUG-08).png
    Daily Spot Gold (14-AUG-08).png
    20.2 KB · Views: 175
  • Daily Spot Gold 1(14-AUG-08).png
    Daily Spot Gold 1(14-AUG-08).png
    19.8 KB · Views: 165
Ljr,

Sorry, tried to copy my charts as per above as previously the only way i've managed to do it was to copy it into word. When i tested it before i loaded it it worked. I'm on Capital spreads. Any pointers to saving their charts?

Glen

I don't know Capital Spreads but if there isn't a save chart function then just use the Alt-Print screen and paste it into MSPaint them save it as a bmp or jpg file.
 
AUD/USD - chart upload test

Hi all

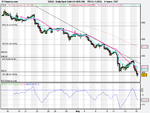
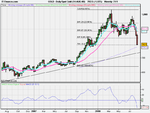
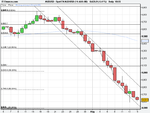
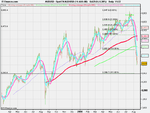
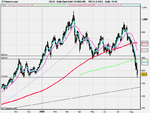
I would like to know what you all think about the AUD/USD, if it gets down to 8500-20 area

I think it is one to watch because it held up 23/1/08 & 13/08/07, down 24/07/07
It is also 61% fib (heres where I find out I have done this upside down!) from 19.08.07 low to 15.07.08 high

It could hold and reverse some or all of the recent fall (say 9000-9300), or "fail" and continue to 8330 - 8000. Was the pin on Wednesday an early indication of sentiment leaning towards a bounce up?

As mentioned earlier, I'm very much a novice, but feel now that I'm not alone on this incredibly supportive thread and that I'll only learn & improve by posting my interpretation & receiving others feedback

As everyone else always says, heartfelt thanks to TD for this site and its predecessor. I sincerely hope your change of employment is as good as, or better than, your dreams were!

good trading all
Paul
 

Attachments

  • Spot FX AUD_USD (14-AUG-08).png
    Spot FX AUD_USD (14-AUG-08).png
    16.6 KB · Views: 157
Strangely i've had a post sent by e-mail from this thread, but can't find it here! Weird!

It was re the AUD/USD. This is my chart. Interesting to see how others see it. Personally looking to see what happens around 8400
 

Attachments

  • Spot FX AUD_USD (14-AUG-08).png
    Spot FX AUD_USD (14-AUG-08).png
    23.6 KB · Views: 172
Would love to hear some views on Gold. It actually scared me to see it bounce of this line earlier, talk about a premonition.
 

Attachments

  • Daily Spot Gold (14-AUG-08).png
    Daily Spot Gold (14-AUG-08).png
    21.5 KB · Views: 178
Would love to hear some views on Gold. It actually scared me to see it bounce of this line earlier, talk about a premonition.

Stuart, when you get good at drawing these levels you will be amazed because the market will turn at them the large majority of the time. Some markets such as crude oil do it very cleanly - it is literally like magic - others like Cable tend to punch through levels before reversing making them more like zones. I find Crude one of the easiest markets to trade technically but its not for the faint of heart :)
 
Thanks TD. So I'm marking up my charts the right way then?

Can you trade Oil through IG well? The charts I put up seem to have gaps everywhere which I don't like, maybe i'm pulling up the wrong ones?
 
Thanks TD. So I'm marking up my charts the right way then?

Can you trade Oil through IG well? The charts I put up seem to have gaps everywhere which I don't like, maybe i'm pulling up the wrong ones?

I have the same problem with many commodity charts on IG.
 
Would love to hear some views on Gold. It actually scared me to see it bounce of this line earlier, talk about a premonition.

Hi Stuart

I've just looked at my Gold chart and I had a line in at 772.76 (yours is a little higher at 773.84). I would have drawn this in a month or so ago. However I didn't take much notice of it as I also have one at 811.98, which didn't seem to register anything this week (you haven't anything until 945.25)

I only look at 4hr & daily timeframes (although use weekly & monthly to find the more 'important' S/R levels)

Having said all of that the last 4hour gold candle I have looks suspiciously 'pin' like. Where's it going to do you think?

Paul
 
Hi Paul

Agreed it looks pin like, but i'd rather be taking short positions in pins off resistence at the moment than trying to predict the turn. Will see how it plays out, but it isn't for me today
 
Hi Paul

Agreed it looks pin like, but i'd rather be taking short positions in pins off resistence at the moment than trying to predict the turn. Will see how it plays out, but it isn't for me today

I'm not sure its a 'technical' pin, as it's close isn't within the range of the left eye, its body isn't quite in the top 3rd. It does have some 'pin-esque' features like a small body, long nose poking out from surrounding prices and touching a S/R level. I wouldn't be surprised if it gets close to 802.

I appreciate what you say re: looking for the higher levels to indicate a continuation of this weeks down trend though (that'll be trading 'with the trend') a very good point. I guess 800 will be interesting as a round number?

Paul
 
Looks to me like they'll be resistence around $800-802. Will watch to see what happens there. Don't fancy any trades "live" over the weekend either so it might be an early start Monday instead!

Just a thought. Maybe we could have threads specific to certain trades. Might clear this one up a bit. I'll start a gold one.
 
Gbp/usd

so did anyone get into cable this morning? there was a pin bar (not the best looking) at 9am 1hr tf that bounced off the 18520 s/r.
seems to be some s/r at 18666 which it is struggling with but I am expecting it to get to 18750

thanks TD for the levels.

edit - also forming a better looking daily pin
 
Last edited:
us/yen,eu/us us/chf all at decisive price levels. have to be watched next week, could be some more nice breaks. little pin on the us/chf dailys,not much of a shadow , but in a good place ??mabye a hint of direction??
 
Everyone has obviously seen Cable daily TF right? Right off the 1.8500 level as expected...

I'll personally be looking for the lows of the previous day to be tested (look for an hourly pin or inside bar around 1.8615) adding more if the pin goes.

If the pin goes first then I am in but stops 5-10 pips below the previous day. If it breaks up, switch to hourly and buy breakouts of hourly consolidation patterns agressively.

It is often the case that the bull moves in a downwards trending market are the sharpest.

Targets are 1.9140 and 1.9330.

Don't see it going much higher than this before its time to look for shorts.
 
Last edited:
Status
Not open for further replies.
Top