You are using an out of date browser. It may not display this or other websites correctly.
You should upgrade or use an alternative browser.
You should upgrade or use an alternative browser.
Best Thread Potential setups
- Thread starter trader_dante
- Start date
- Watchers 274
- Status
- Not open for further replies.
hey omni,i could but it would be a waste of time,on the usd yen chart for eg.i had one trade,short yestererday got stopped out for a loss today(10821) when i was at work just before that big red hourly candle 🙁currently short @- 4)both weak trades and neither would i have entered with real money.that is the very problem,im not often here to catch them.BUT when i am i often trade trendline,range breaks and they work.how do i trade them??i assume this is a bit of a challenge omni judging by your knowledge of trading and im not about to rise to it😗innocent:i enter a position when the candle that breaks the line is either obviously broke( which is why i draw my,what i call.my tradable lines from the shadows not the close.you will miss a 3rd of the price move many times in hourly tfs waiting for the candle to close.OR i sell the break(in case of shorts)of the low of the previous swing low within the pattern.for eg,if the lets say triangle break is only ten pips or so from the previous swing low i will wait for the previous low to be taken out for confirmation.
of course theirs them pivots n fib to work in but thats the commen sence trading bit no??
then theirs the other side ...trading WITHIN the ranges. that can be profitable also.pins n stuff are great for this. im currently short us cad,hoping for a 20 pip trade before bed!!😴😢
took 30 pips on the u/y trade(hit target),lost 9 on the us cad short,it managed +16 last i looked 🙁( at least i moved my stop) 🙂
out of oil (+50) cos of the fibs,lookin for an entry at a swin low of the break
sorry were you long or short? Looking for another long or short entry?
I assume you are playing reversals in this zone?
sorry were you long or short? Looking for another long or short entry?
I assume you are playing reversals in this zone?
yeh long, jus closed 1 of my best shorts on oil so yes tradin the reversal on the pin.went long at thre 61.8 ret. but got stopped by the news(i think) .currently trying again(123.19)
Last edited:
Hi Jonjyeh long, jus closed 1 of my best shorts on oil so yes tradin the reversal on the pin.went long at thre 62.8 ret. but got stopped by the news(i think) .currently trying again(123.19)
hope you held out in oil!!! what a great trade.
I didn't have enough margin in my account to cover even the smallest trade so couldn't take it 🙁 but at least i learnt from the setup.
hopefully after a bit more testing i can add some more cash to take trades like these.
well done
Simon
For those of you that like the longer term trades, check out.......>>
Aussie pairs....... namely:
EURAUD (long)
GBPAUD (long)
AUDUSD (short)
AUDJPY (short)
Wait for pullbacks.
And.....
EURNOK (short)
EURUSD (short)
EURJPY (short)
Some major levels / price action being seen in these.
Daily & Weekly tf.
Sorry, no time for charts.
Aussie pairs....... namely:
EURAUD (long)
GBPAUD (long)
AUDUSD (short)
AUDJPY (short)
Wait for pullbacks.
And.....
EURNOK (short)
EURUSD (short)
EURJPY (short)
Some major levels / price action being seen in these.
Daily & Weekly tf.
Sorry, no time for charts.
Attachments
Last edited:
Hi Jonj
hope you held out in oil!!! what a great trade.
I didn't have enough margin in my account to cover even the smallest trade so couldn't take it 🙁 but at least i learnt from the setup.
hopefully after a bit more testing i can add some more cash to take trades like these.
well done
Simon
hi there Simon,still holding,thanx,would have taken profits on real cash by now but fell asleep!! currently +99,lets see what happens om monday🙄
Last edited:
easy Stuart14,dont understand completely.do you mean you have been trading the false breaks ie.waiting for a false break and trading in the opposite direction??and what time frames?? :?:PB's in the past clearly mark turning points but I do think it is easy to brush over the PB's that actually signified nothing. That is clearly where the S/R, fibs etc come in.
I am also trading a break out strategy at the moment, although am struggling with my own rules. I made a lot of money last week trading the failure of break-outs. This week i've given it all back where there have been fakey failures followed by true breaks.
Distinguishing between a true and a fake break seems to be impossible?
superspurs
Established member
- Messages
- 618
- Likes
- 139
one to look out for on monday.
eu/us 4hour chart shows bullish divergence on both rsi (9) and stochs,coming from oversold levels.nice downtrend to reverse and price currently ranging in a bullish wedge formation.the cream is a bullish IB heading through a pivot,only with it being the friday close candle i personaly dont take it as seriously.also in traffic.
daily chart also shows div and is oversold. pretty indisisive candles though although could be a good thing for a trend reversal??
hourly chart could be showing a 123 reversal pattern but dont know it well renough to say???ant comments??
Attachments
one to look out for on monday.
eu/us 4hour chart shows bullish divergence on both rsi (9) and stochs,coming from oversold levels.nice downtrend to reverse and price currently ranging in a bullish wedge formation.the cream is a bullish IB heading through a pivot,only with it being the friday close candle i personaly dont take it as seriously.also in traffic.
daily chart also shows div and is oversold. pretty indisisive candles though although could be a good thing for a trend reversal??
hourly chart could be showing a 123 reversal pattern but dont know it well renough to say???ant comments??
What price does it go bullish? If it does, what date was the change in sentiment? Just curious.
Cheers,
Paul.
hi paul71,at what price does it go bullish??im tempted to say when it goes up!!but i wont.its just its sunday 🙂,its just that this q. is a cointradiction to your next??(one future tense and one past tense//)but in short,imo any sustained rise above 156.50ish would indicate bullishness.What price does it go bullish? If it does, what date was the change in sentiment? Just curious.
Cheers,
Paul.
i would rather say that if the pattern breaks to the upside and retraces to a hl than this last low and continues to show some strengh,then that would be the bullish confirmation for me.
At what date did the sentiment change? dont think its possible to say yet as imo its not shown any confirmation of change in sentiment.the pattern along with the divergence shows a pause in the current downtrend,and a POSSIBLE change in sentiment.mabye the trend will continue .i like to think of divergence as showing a higher value being given to the instrument(sentimentaly) as the price gets lower.(in case of falling prices)but wether that will be a true representation only time will tell.
I would be tempted to go long at 155.90(stop @ 155.20) and target 156.30 as my intitial
target.Its just that its Suday eve/Monday morn blues time for me.wouldnt trade untill Euro open at least.
hope iv made some sense.would welcome some feedback .👍
Attachments
Last edited:
hi paul71,at what price does it go bullish??im tempted to say when it goes up!!but i wont.its just its sunday 🙂,its just that this q. is a cointradiction to your next??(one future tense and one past tense//)but in short,imo any sustained rise above 156.50ish would indicate bullishness.
i would rather say that if the pattern breaks to the upside and retraces to a hl than this last low and continues to show some strengh,then that would be the bullish confirmation for me.
At what date did the sentiment change? dont think its possible to say yet as imo its not shown any confirmation of change in sentiment.the pattern along with the divergence shows a pause in the current downtrend,and a POSSIBLE change in sentiment.mabye the trend will continue .i like to think of divergence as showing a higher value being given to the instrument(sentimentaly) as the price gets lower.(in case of falling prices)but wether that will be a true representation only time will tell.
I would be tempted to go long at 155.90(stop @ 155.20) and target 156.30 as my intitial
target.Its just that its Suday eve/Monday morn blues time for me.wouldnt trade untill Euro open at least.
hope iv made some sense.would welcome some feedback .👍
The sentiment has changed jon. It's changed to bullish, there is a tell tale action. Good luck, mate.
why dont you share it with us then??if you know stuff i dont im all hears mate.The sentiment has changed jon. It's changed to bullish, there is a tell tale action. Good luck, mate.
here i am posting a bullish setup after all.i dont see the change to bulls only a pause from the bears,you say its allready changed. wish youde share it then ,isnt that what we are here for.
Last edited:
why dont you share it with us then??if you know stuff i dont im all hears mate.
here i am posting a bullish setup after all.i dont see the change to bulls only a pause from the bears,you say its allready changed. wish youde share it then ,isnt that what we are here for.
Hi jon.
I can't tell you what is in words, it's too complex. I'm using a third generation hybrid oscillator alongside a very powerful mathematical model based on PVT.
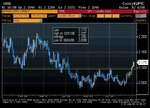
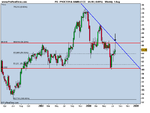
for the longer term men this chart is worth keeping an eye on.the 38% fib coincides with a pivot i have on my chart,.7830ish. next stop looks to be around the 50% and the lows in march n april
it looks more like just an established range than the pattern you describe
- Status
- Not open for further replies.
Similar threads
- Replies
- 2
- Views
- 8K