Best Thread Potential setups

Status
Not open for further replies.
My best two pinbar trades, were ones off the one hour chart, and TD you would have looked at the pins with utter disdain as they werent 'good' at all. Anyway I WASNT watching them, I put the deals on and went to sleep. The next day woke up and yeeeeeeeehaa :) One trade overnight missed my stop by one pip, good job I didnt close that early eh?

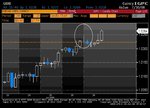
But, Thursday I put two trades on gold, both would have been losers if I left them, but because I WAS watching them, I managed to scrape out about 70% of what I risked on both....

Tricky.
 
TD
Many thanks for the reply; I know that I need to work on the stops and stop closing them up too close and smothering the trade. The thing with the pins is becasue they are at extremes they seem to go a long way when they do take off. It's having the courage and conviction to stay with them all the way and not try and 2nd guess every move.

It's odd because this seems the hardest part of trading to master. I suppose it's due to the less mechanical element and the decision being down to the trader and his emotions rather than the appearance of a pin bar entry for eg!!
Grim
 
Hi guys,

4Hour pins formed on most of the Cad pairs tonight. The usd/cad is the only one at a confluence area, though. I'm still just demoing, so please correct me if I'm wrong.

The pair has climbed pretty steadily the last few days but is now at a resistance area at 1.0240. Drawing fibs from the high on the 10th of June to the low of 15 July, the pin almost touches the 78.6 fib retracement. Fibs on the most recent daily swing high to low, would place the 100 fib level also in that area.

Is it save to take a 4h pin after such a strong daily climb?

Any comments appreciated.
 

Attachments

  • cad daily.gif
    cad daily.gif
    15.9 KB · Views: 176
  • cad 4h.gif
    cad 4h.gif
    14.8 KB · Views: 187
Gold inside bar

Hi Guys,

Wondering what you think of the inside bar that formed yesterday on gold. Would you look to go long?

Formed at boundries of 50 ema and 50 fib.

Only concern is that it has not swung into the position. It has come up from below and staled (for a breather i hope) before possibly moving up again.

Your interpretation/ thoughts are welcome.

Cheers,

Glen
 

Attachments

  • Gold1.doc
    103 KB · Views: 222
  • Gold2.doc
    89.5 KB · Views: 242
Hi guys,

4Hour pins formed on most of the Cad pairs tonight. The usd/cad is the only one at a confluence area, though. I'm still just demoing, so please correct me if I'm wrong.

The pair has climbed pretty steadily the last few days but is now at a resistance area at 1.0240. Drawing fibs from the high on the 10th of June to the low of 15 July, the pin almost touches the 78.6 fib retracement. Fibs on the most recent daily swing high to low, would place the 100 fib level also in that area.

Is it save to take a 4h pin after such a strong daily climb?

Any comments appreciated.

Hi Rider,
Looks like an ok setup to me.
I didnt (and wont be taking) it.
But yeah, looks reasonable..........
 
Hi Guys,

Wondering what you think of the inside bar that formed yesterday on gold. Would you look to go long?

Formed at boundries of 50 ema and 50 fib.

Only concern is that it has not swung into the position. It has come up from below and staled (for a breather i hope) before possibly moving up again.

Your interpretation/ thoughts are welcome.

Cheers,

Glen


It's a bit too messy on the metals for a trade at the moment (imo).
As you say, it has cruised up from the low side to form a nothing bar really.
I think there are better places to be than here at the moment.
 
interpretation/ thoughts are welcome.
Hi Glen,
This is a weak inside bar, IMO. The bodies of the three candles that preceded it get progressively smaller, indicating that buying pressure is on the wain. Price looks much more likely to roll over than it does to breakout to the upside. Added to this, there is nearby resistance overhead at the 38% fib level which coincides with previous swing highs. The pattern looks more like a H&S in the making with a weak right shoulder, hinting that the breakdown might come soon. It's worth keeping an eye out for a false breakout, (a 'fakey') resulting in price closing back within the h/l range of the inside bar, and then look to go short when price breaches the low
Just my 2p worth.
Tim.
 
Looks like the CAD pin has been taken out. It also looks like USD/CAD wants to go to 1.0300 if they can just get enough steam past this current resistance in the 1.0200 area.
 
Hi omni,

Thanks for the reply.

If you'd allow me to be a nuisance; why wouldn't you take that trade? Not strong enough confluence or because it's against a strong trend?

The pin did trigger and then failed. Did I miss something or was it just one of those that didn't work out?

Thank you
 
Hi omni,

Thanks for the reply.

If you'd allow me to be a nuisance; why wouldn't you take that trade? Not strong enough confluence or because it's against a strong trend?

The pin did trigger and then failed. Did I miss something or was it just one of those that didn't work out?

Thank you

Hey Rider,
This is just my opinion but.... regarding that usdcad 4hr pin.
I wouldnt have taken it because........>>

1. the pin on my charting package is v.poor, it is almost a doji
2. the pin formed during the overnight session (makes them void in my opinion)
3. if you look at the daily chart, the area we are in (& resistance level) is slowly getting broken down, look at how it has pulled back off this level.... the pull back is getting weaker and weaker, which suggests a breakout is due, not another sell off, plus, any sell off will be limited in size. I like to see some big reward. This trade didnt suggest a big reward.

Hope that helps!
 

Attachments

  • USDCAD.JPG
    USDCAD.JPG
    191.4 KB · Views: 190
  • USDCAD_d.JPG
    USDCAD_d.JPG
    265.6 KB · Views: 186
Hi omni,

Thank you for the explanation, it certainly does help.

Interpreting the bigger picture is still a bit of a problem for me. I also didn't know that signals forming in the overnight session isn't reliable.

Thank you for the advice. ;)
 
Hi omni,

Thank you for the explanation, it certainly does help.

Interpreting the bigger picture is still a bit of a problem for me. I also didn't know that signals forming in the overnight session isn't reliable.

Thank you for the advice. ;)

The overnight thing is just my opinion.
Try it on paper. See how it goes.
 
gbpusd

I took the 4 hour pin on the gbp/usd. My reason:

You can see that it's at quick swing low in Chart 1

It has formed on a pivot line that has been very active for the last 7 months and beyond in Chart 2

Put 2 fibs on the daily from swing high to the low, then from the low to the current high and you get the 50 and the 38.2 lined up in Chart 3

Everything in a closer view in Chart 4

edit: and stopped out!
 

Attachments

  • gbpusd3.gif
    gbpusd3.gif
    20.3 KB · Views: 163
  • gbpusd2.gif
    gbpusd2.gif
    20.1 KB · Views: 178
  • gbpusd1.gif
    gbpusd1.gif
    11.2 KB · Views: 195
  • gbpusd4.gif
    gbpusd4.gif
    14.8 KB · Views: 192
Last edited:
EurUsd - Daily

Hi All

A good Pin forming on EurUsd Daily. See chart 1. If you zoom out ( chart 2 ) it is touching a long standing ascending trendline. I don't see much other confluence but it is amazing how it has so accurately touched and bounced off that trendline that last provided support back in early Feb 08 and previously in Aug 07.

Will wait to see how the Pin closes. Any views on this?
 

Attachments

  • EurUsd_Daily1.JPG
    EurUsd_Daily1.JPG
    88.6 KB · Views: 176
  • EurUsd_Daily2.JPG
    EurUsd_Daily2.JPG
    118.5 KB · Views: 163
hi yawl,been buzy latley so jus thought id stick my oar in,

it seems nobody trades anything but PBs n IBs or OB!!
im posting my chart of eur/us n us yen jus to show how i view the markets,
i look for price to range in an obvious way,draw lines around the range and simply trade the break(kind of) put that with sup n res, fibs n pivots and trend lines and u cant really go wrong.
pin bars etc imo are great triggers if you understand s,r and pivots and can judge when they are good bars . iv been following these threads for some time now and the newbie mistakes are almost always the same....not taking into account the SUPPORTING FACTORS.these are not graphical trades,they are representations of market sentiment expressed graphically ,but IF you can draw correct trend lines pivots etc it is not always necessary to have a trigger.a timely entry on a trend line break can provide good results also, and maybe an easier way for newbies to start marking the market :) the important bit is getting an angle on the price to see were it is on the bigger picture (that can also be within the same time frame when trading)
just something to bear in mind imo.
 

Attachments

  • update.gif
    update.gif
    31.1 KB · Views: 181
  • yen.gif
    yen.gif
    31 KB · Views: 171
I took the 4 hour pin on the gbp/usd. My reason:

You can see that it's at quick swing low in Chart 1

It has formed on a pivot line that has been very active for the last 7 months and beyond in Chart 2

Put 2 fibs on the daily from swing high to the low, then from the low to the current high and you get the 50 and the 38.2 lined up in Chart 3

Everything in a closer view in Chart 4

edit: and stopped out!

hi there lewtz, wanna put my 2 ps worth in here if you dont mind..
A, your pin bar was a good call imo, but the pair are clearly DOWNTRENDING at the mo. so again imo your good call should have been
B,ignored!!( or scalped)
judging by my chart you could yet have been unlucky
BUT
C, look for a setup to the down side on a down trend no ?? (y)
i think this relates to my previous post,its necessary to identify the general market sentiment to some degree before entering a position.
 

Attachments

  • update.gif
    update.gif
    33.8 KB · Views: 174
Last edited:
Hi jonj,
i look for price to range in an obvious way,draw lines around the range and simply trade the break(kind of) put that with sup n res, fibs n pivots and trend lines and u cant really go wrong.
Well yes . . . and no. Yes in that as trader_dante demonstrates so ably in his Making Money Trading thread and ditto with Newtron Bomb in his forex thread, trading really is quite simple - but it ain't easy. At least, they make it look simple. It ain't easy coz' it's oh so simple to draw those trendlines and fib retracements and pivots etc. in the wrong place. (I hope you're not getting what's simple muddled up with what's easy.) And when the breakout eventually comes, you have to distinguish between the head fakes from the real thing etc. Then there's risk and money management and last, but by no mean least, there's one's ego and opinions which are almost guaranteed to totally coke everything up. Or is that just me!
Making sense of all of this so that we perform in a consistent manner day in and day out is the task that we each must undertake. If you've managed to achieve this objective jonj, then I take my hat off to you but, for most of us - me included - it ain't easy and there's an awful lot that can oh so quickly go so very wrong.
;)
Tim.
 
P.S. good to see some serious traders getting involved in this thread!its what weve been waiting for, :)
thanx n please keep posting. maybe post setup or 2 ?? :)
 
hi there lewtz, wanna put my 2 ps worth in here if you dont mind..
A, your pin bar was a good call imo, but the pair are clearly DOWNTRENDING at the mo. so again imo your good call should have been
B,ignored!!( or scalped)
judging by my chart you could yet have been unlucky
BUT
C, look for a setup to the down side on a down trend no ?? (y)
i think this relates to my previous post,its necessary to identify the general market sentiment to some degree before entering a position.

I was actually shooting for option B at the least being able to scalp(or b/e) on what I felt was at least going to be a minor correction in the down trend. I thought it had potential to head to 1.9900, except I really should have paid attention to that next bar which was showing the market's sentiment. When I woke up it was already stopped out.

Look at my chart attached. To me it looks like those highs are steadly declining and what I was shooting for was nabbing the next correction that you can see the arrow pointing to on my chart. It just didn't happen, oh well!

Thanks for the feed back
 

Attachments

  • gbpusd9-30.gif
    gbpusd9-30.gif
    15.7 KB · Views: 177
Status
Not open for further replies.
Top