You are using an out of date browser. It may not display this or other websites correctly.
You should upgrade or use an alternative browser.
You should upgrade or use an alternative browser.
Best Thread Potential setups
- Thread starter trader_dante
- Start date
- Watchers 274
- Status
- Not open for further replies.
hi folks this is the bitmap of the petrofac stock - on the ftse 100.
Actually -since drawing the chart, and making the mistake with the eurchf which i got stopped out of grr - my fault for putting the ma's in as simple rather than exponential, done the same with petrofac, so it's now broken the 100 ema, as opposed to sitting on the 100 simple ma.
Still - be interested in your thoughts. Not many stocks have maintained an uptrend in the last few months like this one has
Rgds
M
mdsfxtrader that isn't a Pin bar. The nose needs to stick out much further and the body needs to be near the extreme. The price did however move up but based on that chart I would not have taken this trade.
mdsfxtrader
Newbie
- Messages
- 5
- Likes
- 0
Hi LJR, thanks for this input.
That raises further questions.
Having looked at various definitions of pn bars - i havent seen any that suggest specific rules about how far out the nose should stick, and so on. Wondered what definitions or criteria peeps on here use for a pin bar formation?
For instance, what would be considered to be a minimum length of a nose - in relation to the bar to its immediate left for instance - is the nose measured in terms of order of magnitude vs the size of the left bar, or the fat part of the left bar, or the shadow that forms the eye etc? and what about the position of the open/close of the nose in relation to the left bar? What ive seen suggests that the open/clsoe on a pin bar should be within the boundary of the left bar - i havent seen anything more specific than that yet.
Also, I think had I calculated the formation based on ema ma's instead of simple, I might not have entered myself either. Still - I hope to learn without going bust. so keep the comment coming, please.
Rgds
M
Below is the link to Trader_Dante's original thread. It's a long read but well worth it and will answer your questions. In the first 20 -30 pages you should quickly get an idea of what a 'perfect' pin bar looks like. This thread 'Potential setups' is a continuation of that thread so I think most that are posting here have been through the original thread and follow those methods.
http://www.trade2win.com/boards/first-steps/26947-making-money-trading.html
http://www.trade2win.com/boards/first-steps/26947-making-money-trading.html
Last edited:
trader_dante
Veteren member
- Messages
- 4,535
- Likes
- 1,704
The more time you spend watching the markets the more you will realise that they are telling you a story that evolves candle by candle. A battle is being fought between buyers and sellers and watching the candles and thinking about what they are telling you in the context of the high probability turning points and the bigger picture can pay dividends.
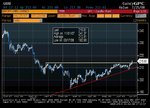
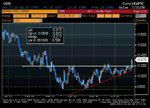
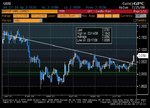
I'll give you an example. Today I was looking at this consolidation in the Euro (see circled area of chart) This chart is zoomed in a little but on the daily TF you will see a longer term double top has formed and on the hourly here you will see previous bar highs (on the left of the image) which are going to be the nearest resistance.
Now the first thing that catches my eye is the rather poor looking pin bar at point 1 on the chart. This showed me that price made an attempt at the high but when it got very near, agressive sellers brought it right back down to within the range.
When I saw this I put on a position to test the market and see how it would react.
As it happens the market moved lower but we then see there is clear support developing around point 2 and I cut the position for a small loss of around 10 ticks.
Price moves up and once again stalls near the top of the congestion zone and then has another go lower at which point I sell it again at my original entry. Again it tests the support, moves up and this time I scratch.
Another hour goes by and we head lower for the fourth time and again I sell and again it holds but this time it's for a different reason because some results came out which immediately put a bid in the Euro. I come out for a scratch and the market soars higher but look how it can barely take out the previous highs from a few hours before let alone the double top (point 3) and this is on bullish news.
By the time the market once again heads lower for a FIFTH re-test of the support (on the hourlies no less!) at point 4 its pretty obvious this market is going to break. How much, how fast we don't know but it is fair to say that an astute trader should be aware of these opportunities.
The reason I like price action setups such as pin bars and inside bars is they give you a place to put your stop that is instantly definable but getting in the habit of reading the price action can give you a heads up on what is likely to happen and can, at times, allow you to "probe" the market with tight stops. If you do this, though, remember, probes should be exactly that. Don't throw good money at something if you are testing it. If it goes there will always be an opportunity to add later on.
+++++++++++
The midly amusing (although not for me) epilogue to this post is that before it broke, I pulled my offers out of the market whilst I was out of the office eating lunch and came back to see it had collapsed. After having sold it three times in anticipation of it breaking (and it having cost you money to do so) you get p*ssed when this happens...but still, I hope the message is clear. Watch the price...
And don't eat lunch when you should be trading! lol
+++++++++++
Attachments
Last edited:
trader_dante
Veteren member
- Messages
- 4,535
- Likes
- 1,704
P.S. Some of the most informative posts on my "Making Money Trading" thread are on this subject of reading the price action by Mr Gecko. They appear late in the thread. He gave a lot of examples and they are top quality posts.
My 1st trade with price action based strategy(or how i made €18 in the stock market!)
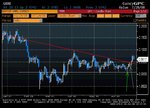
right so where ive been at the last while is here: had a minor trading blowup (my account never had enough money to make a blowup but i lost most of the small amount i had anyway) and then i swore myelf onto papertrading and a stiff course of re-education. this brought me to mr dantes thread and then here. i have no money to replenish my accounts (saving to go travelling for a year) so sticking to the paper stuff still. that has been going ok but im not a huge fan of papertrading as a rule. so i thought id just keep an eye out on any instrument i could afford on my margin (you have few options when you only have €75.20 in your account!) in case i see anything i can have a punt on. today i saw the nasdaq hourly ( i can only afford the daily nasdaq contract!) gap lower, and react, i thought, to a level i had already drawn in from a few days ago. my first clue that it might find support here was at point 1 below.
next i saw a crap pin bar (they rarely seem to fulfil the citeria coz its not a volatile index by comparison but it was still crap)but i thought it was reacting none the less so i went long on its break. as it would have closed at end of day price, i closed it for the princely sum of €18 profit (point 2)... it did of course go on to high which would have had me in profit of €23, but what are ya gonna do.
anyway, every journey starts with one step!
🙂
Attachments
Glenborrell
Active member
- Messages
- 108
- Likes
- 12
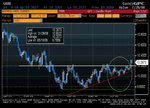
Hammersons
Another one to watch,
Price is approaching an S/R line that dates back to March, june & September of 2005 (see first chart). It's also coming up to meet a decending trendline that has held since the start of it's decline in March 2007. It also lines up with the 38 fib. Note how the last 2 days it's failed to break above this level.
Something to maybe watch tomorrow 🙂.
Glen
Attachments
superspurs
Established member
- Messages
- 618
- Likes
- 139
nice inside bar on cable this am,TD 👍:clap:
trader_dante
Veteren member
- Messages
- 4,535
- Likes
- 1,704
nice inside bar on cable this am,TD 👍:clap:
Saw it and was deliberating but unfortunately I took the one on USD/JPY which took me to the cleaners.
🙁
superspurs
Established member
- Messages
- 618
- Likes
- 139
do you ever have multiple positions
Have a question for you guys.
What is your prefered method of stop loss?
I am always messing about with methods.
Ma's, s/r levels, last bar low, price action reversal, target prices and so on.... anyone got any views? Methods that leave you satisfied?
What is your prefered method of stop loss?
I am always messing about with methods.
Ma's, s/r levels, last bar low, price action reversal, target prices and so on.... anyone got any views? Methods that leave you satisfied?
1Pipped
Well-known member
- Messages
- 273
- Likes
- 35
omni have you ever looked at using parabolic SAR for a trailing stop? I always put my initial stop 1 pip/tic/point above pin bars and trail it in a random-depends-how-i-feel sort of way.
I had a quick look at the sar yesterday, it looks like it might be good due to how it behaves, but it usually means leaving your stop bigger for longer from what I looked at. Not had much time this week so Im going to look at it more at weekend.
I had a quick look at the sar yesterday, it looks like it might be good due to how it behaves, but it usually means leaving your stop bigger for longer from what I looked at. Not had much time this week so Im going to look at it more at weekend.
Check out the attached, i have been waiting for this for a LOOOOONNNNGG time!!
I will be adding more when given the chance.
Obviously pick your favoured pair out of the 3......
Omni,
I have been watching the GBP/CHF setup also but have no idea how to play it. Do you just wait for a good opportunity to get long, ie after a drop in its price like this morning? where would the stop loss be?
or what is the strategy behind this type of wedge(?) setup?
sorry about all the questions!
Thanks
Shane
Hi Shane,
Gbp/chf wasnt my favoured pair of the three (gbpjpy, gbpchf & gbpnok)
Gbp/nok had a better setup & probability in my view.
Check out the attached.
But anyway, i am rubbish at trading "the breakout", too many times i find these to be "fake" breakouts, leaving you in no mans land. So to get round it i was buying in the circled area, when it touched the trend line. There are no "pins" per se, but reasonable price action gave reasonable entries and tight stops below the trend line.
Looking at gbpchf, if you take a look at 21st july, that was the key entry point in my view. (please anyone comment if you disagree), it's a nice inside bar with almost the same low. Or the average looking pin on the 16th was doable should you have been eyeing the long. As i say, i dont take the break of the resistance level, it's too "out in the open" for me. So the pin or inside bar were the plays to take.
If i get an opportunity to add, i will shout it out on here.
Attachments
omni have you ever looked at using parabolic SAR for a trailing stop? I always put my initial stop 1 pip/tic/point above pin bars and trail it in a random-depends-how-i-feel sort of way.
I had a quick look at the sar yesterday, it looks like it might be good due to how it behaves, but it usually means leaving your stop bigger for longer from what I looked at. Not had much time this week so Im going to look at it more at weekend.
Heya 1pipped.
Yeah, I have looked at the parabolic SAR before.
I dont really think it is a practical indicator tho, in hindsight it looks great but if you were really in the trade, i think you would find it too trailing. I am just eyeing the cac with it. If you were long on a daily tf, your stop would be at about the 4105 (using SAR) while we are currently trading at 4388...... a stop of 280 pts just wouldnt turn me on!! Quite handy for figuring where the trend is, but that's about it in my view.
I will keep doing as you do........ and use the "random-depends-how-i-feel sort of way" !!! 😉
Hi Shane,
Gbp/chf wasnt my favoured pair of the three (gbpjpy, gbpchf & gbpnok)
Gbp/nok had a better setup & probability in my view.
Check out the att.....
......doable should you have been eyeing the long. As i say, i dont take the break of the resistance level, it's too "out in the open" for me. So the pin or inside bar were the plays to take.
If i get an opportunity to add, i will shout it out on here.
Thanks for the explanations Omni.
One thing i'm still not sure about Omni is why one would have taken a long position in GPP/CHF from one on the pins from support you mentioned when there was a clear downtrend and the pin would have been going directly back up to this downtrend-ie this trade would have been expecting a break against the trend, but the GBP/NOK was taking a trade with the trend. I hope I'm being clear in my questions.
Cheers
Shane👍
That is exactly the reason why gbp/chf was the poorest setup of the three.
- Status
- Not open for further replies.
Similar threads
- Replies
- 2
- Views
- 8K