Best Thread Potential setups

Status
Not open for further replies.
joy global.

if we trade this pin bar, then price will be very near area which was previously support. so im not sure whether to trade this.
 

Attachments

  • joy global.JPG
    joy global.JPG
    143.4 KB · Views: 166
jacobs engineering group

it has retraced quite a bit and above the 50 sma, but previous pin bar was successful.
 

Attachments

  • jacobs engineering group.JPG
    jacobs engineering group.JPG
    138.3 KB · Views: 141
gpbusd

touhcing 50 fib, between the two ma's and going with the trend. tp 2.0158, r:r =1:3
 

Attachments

  • gbpusd.JPG
    gbpusd.JPG
    161.8 KB · Views: 193
dow chemical

the gaps been filled, maybe its going to go down again with the trend. R:R looks good.
 

Attachments

  • dow chemical.JPG
    dow chemical.JPG
    434.6 KB · Views: 156
applied material.

and what about this?

Many thanks. also, can i ask TD, how many pin bar trades do you execute per week on average? it seems very rare, and who is your broker? thanks.
 

Attachments

  • applied materials.JPG
    applied materials.JPG
    161.6 KB · Views: 184
and what about this?

Many thanks. also, can i ask TD, how many pin bar trades do you execute per week on average? it seems very rare, and who is your broker? thanks.

Hey london-eye,

I don't execute many pin bars per week and there is no consistency in the number to be able to give you an idea. I mainly trade inside bars as the rewards are just as good and the stops are tighter. I trade hourly and daily TF across 7 markets at work and get about 3 - 4 trades per week.

You've posted a lot of charts so I'm going to have to be brief on my analysis.
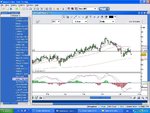
Applied Materials

A good s/r level but I prefer the nose of my pin bars to stick out from the surrounding price action. Most of the range of this pin is within the range of the previous day. This is a no go for me.

Devon Energy

This is not a pin bar, it is an inside bar.
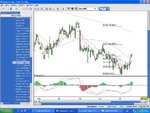
Dow Chemical

This is an excellent looking pin bar as the nose is long and the body is near to the top of the previous bar. Just for reference, the level you have looks like it should be a little higher so that it runs across the top of the last swing high and meets the lows of the swing low in the middle of the chart.

Flextronics

Body of the pin is a little low down the previous bar and from what I can see of your chart (which is hard without full data) this doesn't look like any kind of level as it runs right through the middle of all the price action.
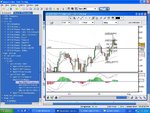
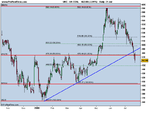
GBP/USD

A better looking pin and a good level.

Jacobs Engineering Group

Again a good pin but not sure about that level at all.
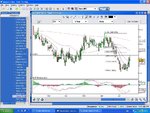
Joy Global

Pin bars to go short should be a swing highs. This is at a swing low. Doesn't mean you shouldn't trade it but it's not one for me.

Limited Brands

Alright looking pin but again I am wary of the level. From what I can see of the data in your chart, it doesn't look like there is any level there to me. Pin bars are not what make this strategy profitable, levels are. Concentrate more on them than finding pin bars.

nisource

Body of this pin is way too large and price that leads up into it in the few bars before doesn't constitute a swing.

Petsmart

This look like a pin bar but it is really an inside bar when you take it in relation to the surrounding price action.
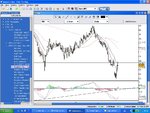
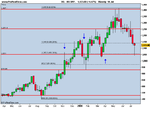
SPX

I like this setup but it's about to be invalidated.
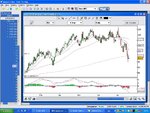
Verisign

No swing on this bar. It appears in what I call "traffic". That is to say within a sideways range.
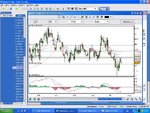
Amazon

This is not really a pin bar.

To recap, most of your setups are not pin bars and your levels are not very strong. Hope you don't think I am shooting you down in flames as someone else recently accused me of doing it's just that you really need to go over my thread more carefully. The strategy is simple but it should take you months to learn it and begin to trade it profitably.

First and foremost don't make the mistake that so many people that read it for the first time do and go looking for pin bars everywhere. It's not about that. It's about defining high probability areas on the charts and then watching how the price behaves around them. Pin bars are just one indication of a reversal. There are many others that will give you clues too. Inside bars indicate consolidation - I like to play breakouts of them when they appear at good levels. Bullish bars indicate strength, bearish bars indicate weakness etc etc The list is very long.

If you are looking for pin bars, finding them and then drawing in your levels etc after you have found them, you are doing things the wrong way and you will have poor results accordingly.

Read the thread carefully it should answer all your questions.
 
Last edited:
A trade I am in long at the moment.

It may give other opportunities to get onboard. Look for price action at higher levels or pullbacks.
 

Attachments

  • gbp1.gif
    gbp1.gif
    22.9 KB · Views: 292
A trade I am in long at the moment.

It may give other opportunities to get onboard. Look for price action at higher levels or pullbacks.

hey t_d. am just wondering if you (or someone else) could explain inside bars for me? obviously, its a bar with a range inside the range of the previous bar, but where are you looking for it to break out? from what i have read is it that you play the break to whichever side of the bar it breaks, wherever it may be? also where do you put your buy/sell order?? is it, like pins, that you use the bottom of the bar (or top for that matter?)
 
from what i have read is it that you play the break to whichever side of the bar it breaks, wherever it may be? also where do you put your buy/sell order?? is it, like pins, that you use the bottom of the bar (or top for that matter?)

Exactly that. Entries go at the top or bottom of the bar with stops on the other extreme.
 
Linear Tech

Here is a US stock to keep an eye on.

Linear Tech is approaching a S/R that lines up with the 50 fib.

Something to watch over the next few days.

Notice it all started with a pin.

Glen
 

Attachments

  • Linear Tech2.doc
    89 KB · Views: 258
  • Linear Tech1.doc
    99.5 KB · Views: 238
im not playing this as im fully loaded at the moment,not sure if it has triggered,some might be interested
 

Attachments

  • BG GRP..png
    BG GRP..png
    9.6 KB · Views: 197
im not playing this as im fully loaded at the moment,not sure if it has triggered,some might be interested

looks interesting. the crude chart dante posted would seem to corobaorate this trade. also, most indices have similar pins to this one.
 
ive been waiting for this one to setup for a little while.price has broken the trendline signalling weakness,fib confluence at the S/R line and a bearish engulfing candle.its short for me tomorrow,i originally thought i would get a long setup in this area
 

Attachments

  • UK COAL2.png
    UK COAL2.png
    13.1 KB · Views: 237
ive been waiting for this one to setup for a little while.price has broken the trendline signalling weakness,fib confluence at the S/R line and a bearish engulfing candle.its short for me tomorrow,i originally thought i would get a long setup in this area

is this an inside bar setup super? is it bearish because the previous bar is the inside one??
 
is this an inside bar setup super? is it bearish because the previous bar is the inside one??

No, it's a bearish engulfing bar.

You see there are so many different types of price action setups. What superspurs is doing is looking for the levels in the market where price will react. In this case he was expecting it to turn but it crashed through the support levels and now the engulfing bar indicates that the move is going to continue on down.

I like this one super, particularly because the high of the engulfing bar came close to testing the broken TL from below. This is a good sign.

Be careful of the 450 area though - it looks like it could be a pivot.
 
here's one for you guys

jon

ps sorry about tatty image
 

Attachments

  • lloyds.GIF
    lloyds.GIF
    18.7 KB · Views: 208
Bg

im not playing this as im fully loaded at the moment,not sure if it has triggered,some might be interested

Spurs,

Just a warning. It looks to be rejecting off an ascending trendline which it broke last week. This trendline started in August 2007 and has held since then. I appreciate it's a weekly pin however my weekly sits just below the trendline.

See charts.
 

Attachments

  • BG1.doc
    91 KB · Views: 223
  • BG2.doc
    89 KB · Views: 199
  • BG3.doc
    85.5 KB · Views: 203
Lloyds

here's one for you guys

jon

ps sorry about tatty image

Jon,

Nice call. i've got the pin almost touching a Support line and the 50 fib. It's also being rejected by the 50 ema.

I've attached my charts.

Glen
 

Attachments

  • Lloyds1.doc
    88.5 KB · Views: 211
  • Lloyds2.doc
    84.5 KB · Views: 210
Status
Not open for further replies.
Top