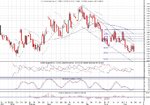
Good idea. Attached is my take on the USD/CHF from the daily chart (attached)
1. The local bottom is a bounce at 1220, which is close to the the 127% fib retracement at 1222 and long term support at 1219
2. The bounce stopped at 1239 where it met the 20 period MA and also the parabolic SAR.
We could look at 2 scenarios:
1. It will test support at 1219-1222 and drop through, next stop the 161.8% retracement level after which it could test 1200. I suspect it would not breach that and a steady climb back would happen.
2. It will test support at 1219-1222 and bounce back and begin a climb back from there.
Of the two scenarios, I suspect the second may be more likely given:
1. proximity of the parabolic SAR
2. Bullish stochastic hook
3. Bullish feel to the MACD
On the other hand I am a novice so what do I know? the square root of bugger all.
Comments?
MT
dc2000 said:
Good afternoon Peeps
Firstly I would like to point you in the direction of animal lesson number 6, in this story the young Socc starts mimicking a donkey this in turn starts the other donkeys braying pretty soon all the donkeys have stopped doing their work and are instead braying for no apparent reason much to the pleasure and amusement of the young Socc. As soon as he goes away every thing calms down and the donkeys get on with the task in hand without realising why it was that they were distracted in the first place. The lesson learned by Socc is that by use of antagonistic tendencies he can infact create havoc in an otherwise calm enviroment.
I would suggest the only persona we need to develop is one that would allow us to get on with the job in hand and not be side tracked by the showboating that was yesterdays posts.
And before Socc posts " you do it then " I already do and far in advance of any action
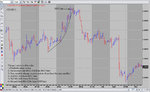
Now on to the matter in hand The chart posted by DT shows that instrument tends to inch higher over a few days and is then taken back to or below recent lows in a short space of time. The last two days price action on the chart show it moving slowly higher. Therefor we can use this historical movement to predict that there is a good chance of it diving to recent lows over the next few days.