'No indicators' revisited

I was merely towing my line in my way and i can honestly say that its not my intention to disrupt the thread but more to keep folks on their toes,bright lights can be blinding :( . Its in my nature to be straight down the line and say it how i see it, i can see this has troubled some.

This is my last post to this thread (and indeed perhaps to this site if im banned for it)

ps 1. guess this means the jesters job is up for grabs ;)
ps 2. as my previous posts have been deleted, what did i say that was so offensive?


dt
 

Attachments

  • ooooo.JPG
    ooooo.JPG
    83.3 KB · Views: 279
Last edited:
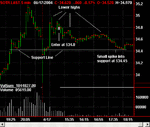
Here is my interpretation of the trade on SOTR which I took based on price and volume. My reasoning is as follows:

The markets opened negatively across all the indices, Dow, S&P and Nasdaq
So I was looking for a stock that would have previously had a good level of accumulation and which there was a good liklihood that those who had accumulated it would want to distribute it over a long time. SOTR fitted this criteria

Looking at a 5 min chart, you can see that at the end of the previous day there was a large increase in price along with strong volume and a sell off at the end of the day by those who did not want to hold positions overnight.

At the open there were attempts by Bears to push the price right down but this was on less volume than was seen at the previous close and those who had accumulated the stock prevented this from happening which I presumed was because they wished to unload it at higher prices and a longer time frame and the closes were above the middle of the bar in this attempt. There was then an attempt to move prices back up towards the previous day high but on mildly increasing volume. This failed and the stock made a lower high and I visualized an imaginary trendline (which has been suggested on this thread) which I have included for the purpose of this post. I wanted to see if this line would be broken when tested. It wasn’t and on steady volume a lower high was then made again at which point I decided to Short the stock and was filled at $34.80

Volume then died off almost completely but with price steadily declining and once a 0.5% move had been made in the stock I closed just over half my position at $34.61 for +19c

As previously mentioned I closed the second half at $34.65 because the match was on but I would have closed the second half at $34.45 because this had become a support level as marked from previous price action and because there was a volume spike into this price at around 6.00pm and because this also represented a 1% move in stock price.

OK this is not the most elaborate of explanations but I did do this in realtime and on price and volume action only which is a different approach to how I would normally trade as I usually include Level II as well as a number of other factors.

So darksiders your comments please


Paul
 

Attachments

  • SOTR.gif
    SOTR.gif
    9.6 KB · Views: 412
Trader333 said:
OK this is not the most elaborate of explanations but I did do this in realtime and on price and volume action only which is a different approach to how I would normally trade as I usually include Level II as well as a number of other factors.
Paul, I dont feel qualified to express a view on your interpretation as I'm a dedicated lurker on this thread, but it looks pretty good to me.

My reason for posting is to ask how you managed to keep away from LII on entry/exit - I know it's your forte,

Surely Dark-Siders wouldn't be averse to using additional 'tweaking' to get the best entry/exit after having established their view?
 
I've nothing to add really. It's not an indicator. It offers more information on who's doing what.
Whether you know how or when to use the available information is another matter.
I'm not trading stocks so I'm not using it, but if I ever switched across I would definitely give it a chance.
 
Last edited:
Oaty, the matter is the matter that engages our interest as all of us here are devoted to the pursuit of knowledge, so if you are willing or able to expand, I am sure the audience would greatly appriciate it.

Even if I knew how to read L2, I don't think I could describe that split second when a trading decision is made. It's part of a larger picture that's already in place. "Something" tells you to pull the trigger. What that "something" is I wouldn't know. My thought is that it will be different every time. Experience, I suspect, is the answer.
 
skimbleshanks

May I refer you to the post by Trader333 no 1120 and the attached chart.

Does the first bar marked lower high qualify as a Gap & Trap Bar ie. It's high was higher than previous bar's high but closed below the previous bar's close?

Regards

bracke
 
Trader333 said:
Here is my interpretation of the trade on SOTR which I took based on price and volume. My reasoning is as follows:

The markets opened negatively across all the indices, Dow, S&P and Nasdaq
So I was looking for a stock that would have previously had a good level of accumulation and which there was a good liklihood that those who had accumulated it would want to distribute it over a long time. SOTR fitted this criteria

Looking at a 5 min chart, you can see that at the end of the previous day there was a large increase in price along with strong volume and a sell off at the end of the day by those who did not want to hold positions overnight.

At the open there were attempts by Bears to push the price right down but this was on less volume than was seen at the previous close and those who had accumulated the stock prevented this from happening which I presumed was because they wished to unload it at higher prices and a longer time frame and the closes were above the middle of the bar in this attempt. There was then an attempt to move prices back up towards the previous day high but on mildly increasing volume. This failed and the stock made a lower high and I visualized an imaginary trendline (which has been suggested on this thread) which I have included for the purpose of this post. I wanted to see if this line would be broken when tested. It wasn’t and on steady volume a lower high was then made again at which point I decided to Short the stock and was filled at $34.80

Volume then died off almost completely but with price steadily declining and once a 0.5% move had been made in the stock I closed just over half my position at $34.61 for +19c

As previously mentioned I closed the second half at $34.65 because the match was on but I would have closed the second half at $34.45 because this had become a support level as marked from previous price action and because there was a volume spike into this price at around 6.00pm and because this also represented a 1% move in stock price.

OK this is not the most elaborate of explanations but I did do this in realtime and on price and volume action only which is a different approach to how I would normally trade as I usually include Level II as well as a number of other factors.

So darksiders your comments please


Paul

I have looked at it carefully.
Can't fault it, very good, well done!
 
Pinning it :~

oatman said:
Even if I knew how to read L2, I don't think I could describe that split second when a trading decision is made. It's part of a larger picture that's already in place. "Something" tells you to pull the trigger. What that "something" is I wouldn't know. My thought is that it will be different every time. Experience, I suspect, is the answer.

No Oaty, it's not ! Go back have another look ~ see if you have a realisation !
Go back over the reel of film inside your head, play it back until you identify
the single frame that matters! See if you can pin it !
 
Last edited:
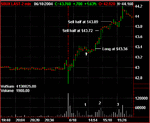
Here is the trade of SBUX and the reasons why.

The Dow and S&P opened negative but the Nasdaq was positive so I was looking to see which was going to be the leading indicator, ie would the Nasdaq go negative or would the Dow and S&P go positive. As it turned out the S&P and Dow followed the Nasdaq and went positive so based on that I was looking for a stock that had moved up with the Nasdaq but was now in a consolidation phase and SBUX fitted this criteria.

At the open there was a massive attempt by Bears to force the price down as can be seen by the huge volume spike on the attached 2 min chart. This failed and the price closed well in the upper half of the bar.

After this the price moved up on decreasing volume and there was a final attempt by the bears to move prices down marked at point 1 on the volume chart but there was no significant follow through and the price closed midway along the bar as shown by the white arrow.

After this the volume died off for a short while and then prices started closing slightly higher on increasing volume. The S&P and Dow had now moved into positive territory as well as the Nasdaq starting to move up and I decided to go Long as I considered this to be a low risk opportunity. I was filled at $43.36 and placed a mental stop at $43.26 so a 10c risk on the trade if it went againt me.

The market continued to go up on increasing volume with closes at the top of the bar. At point 2 on the volume chart there was a volume and price spike and I decided to close half my position for +36c as it was also at greater than 0.5% move in stock price. At point 3 on the volume chart there was another price and volume spike and the stock price had made more than a 1% move so I closed the remaining half for + 53c

Again I welcome comments from more experienced darksiders on this trade.


Paul
 

Attachments

  • SBUX.gif
    SBUX.gif
    9.2 KB · Views: 383
hello Trader 333,

Before we proceed can you confirm the price did ripple sideways yesterday from 1948 to the close? Did you watch it yesterday ? Have you got a chart for yesterday that you can post,
as I would like to see the background if possible please. Then we can proceed in much
greater depth if you like ? I am going to hazard a guess, and say staircase.
 
Last edited:
Socrates,

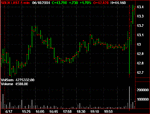
Attached is the SBUX chart for Thursday which I have had to change to 5 Min to get the whole day in. The total volume for the day was 2.1M and although I had not watched it yesterday, I was aware that the price action from 19.48 to the close was consolidation.


Paul
 

Attachments

  • SBUX2.gif
    SBUX2.gif
    9.8 KB · Views: 314
Trader333 said:
Socrates,

Attached is the SBUX chart for Thursday which I have had to change to 5 Min to get the whole day in. The total volume for the day was 2.1M and although I had not watched it yesterday, I was aware that the price action from 19.48 to the close was consolidation.


Paul
Hello 333, look at my post 1159# in relation to your previous post 1158#

This comment relates to your post 1160#

Here you display a chart for the instrument as requested for the previous day.

I am pleased to see my assesment was correct in that if you look carefully
before you posted, this price action anticipated and then displayed a few minutes later in the chart displayed on chart 1158# did turn out to be the result of staircase. I had no idea what the background might have been before I was able to deliver a conclusion.

This is done through what I listed in a previous posting referring to the use of time.

This assessment was carried out in Net Present Time and related to Past Time and
Net Past Time, before being presented with the record.

From this you can begin to deduce that Futurology deals with events "still in the pipe"
and not yet caught up with by Net Present Time

Historology deals with events that have occurred in the past in which Net Present Time
has caught up with and then appear clearly as a record of what has happened.

I am telling you this so that you are aware that the ability to manipulate time by
intangibly warping it forwards and backwards at will, on command, is done.

I took trouble to demonstrate Futurology for the audience in the excercise I carried out
for your collective benefit with qaza on the Dax in a previous post in which everything was
logged in advance of it occurring ~ yet no one took any serious interest in it.

I do hope you are now able to see that it is not only the price and the volume that can be
manipulated but as time itself is not linear, but the clocks record it as such, and consequently it can be "warped" to the convenience of the viewer to make it go more slowly when futurologising although it is recorded in linear form on a chart as well. Conversely it can be "warped" to the convenience of the viewer to make it go more quickly when dealling with an unseen (yet to be confirmed) histogram.

This means that non linear time can be made to go more quickly, ahead of linear time.
This means that non linear time can be made to go more slowly, behind linear time.

The rate to which non linear time can be accelerated in relation to linear time, is somehow proportionately related to its futurological use.
Conversely the rate to which non linear time can be decelrated in relation to linear time, is
somehow realted to its historic use.

This means that slow movement can be anticipated one or two price schedules ahead.
Fast moves can be anticipated five, or I have experienced thirteen, and once twentyone price schedules ahead, but no further.

Albert Einstien,
the brilliant physicist who discovered relativity and who put forward The Theory of Relativity,
had hanging in his office and study in Princeton University a notice that read:~

Not everything that counts can be counted,
and not everything that can be counted counts.

I promised you we would go stratospheric with this.
 
Last edited:
last Friday

ok my QCharts are back to normal, and I am posting the enalysis I promised.

I personally think it is important as it shows that u need to keep your eyes open on various underlyings EVEN if u trade only ES.

ok - Friday morning, u may argue a sloppy start on ES in the opening minutes but look at Comp 5 min (same on NDX100). Clear strong maribozu up right out of the gate on a very decent volume. What is the risk profile of a long entry here? very low indeed :cool:

A - 10:30 on the clock and Comp records a pretty much hangman on a failed penetration of 2000 level. What is volume saying? look at ES. Lower volume on a slightly higher spike - shorts (and longs jumping out) are not finding as many bids as 30 minutes ago, are they? What does that mean? They will HAVE to sell at lower prices. Lower prices next to guaranteed.

Now important bit IMO:

B - look at B point in the afternoon. Price comes down to 1133-34 level where most longs entered in the morning. Now look at cumulative "square' volume. About 1/3-1/4 of the morning longs. What does that mean? Only 1/3-1/4 of morning bulls jumped out of their long positions BUT BRINGING the tape reading to where they all got in there!

Now u r one of those longs who r still long after B. U do not have the luxury of closing your long at a profit any more - plus u r getting concerned u may have to do so at a loss - if another selling leg follows. What u do? U use any up tick to get out. Do u expect this to rally into the close into the weekend now? :LOL:
 

Attachments

  • Nasdaq Combined Composite Indx- 5 minute.jpg
    Nasdaq Combined Composite Indx- 5 minute.jpg
    26.2 KB · Views: 269
  • CME-ES04U- 2 minute.jpg
    CME-ES04U- 2 minute.jpg
    53.8 KB · Views: 299
Top