'No indicators' revisited

clylbw said:
Hi SOCRATES,

I would be very grateful if you could tell me your opinion, but the questions were for anyone who would like to share his or her thoughts. Thanks really for asking. :)

OK, I have dinner guests, I have just popped in to look. I promise I shall be replying in detail later.
 
a320 said:
This dodgy theory worked well for us today...the overbalancing (exceeds 1:1) of a correction in a larger degree (the 33 points one) @ 1108.25 gave a clear signal you had to go long on the under balancing (less than 1:1) correction in the (minor degree) to the 1105.75 area.. but ignorance is $$ for us.. :cool:
Did people get the SQ9 180' level at 1108.25 area?? :) ))

Maybe I'll have to jump to China's Thread... :cheesy:


CJ :cheesy:

CJ

with reference to the above, is there a thread or post on t2w which explains your post in some detail ?
 
clylbw said:
Like I said before, I have learnt a lot from this thread, which is among the best materials I have ever found about trading. However, the methods discussed here are obviously not for everyone. If you do not like them, please look elsewhere; there are plenty of choices at T2W.

To me, this thread has become the door to the Dark Side, and I have come to see many of you who have kindly offered your help as my great friends, although we may never have met. If this door were shut, It would be a great loss to me and other people alike who have started the journey towards the Dark Side, and I would really miss all my friends here.

So, PLEASE, keep the heated arguments away. As mentioned above, if you do not like the methods here, simply look elsewhere. Please respect the right of our similar-minded people to discuss our own approaches here.


I'm back. Good ! Well said. It is not a question of heated arguments. It is a question of facts,
pure and simple. When a nonsense has to be flattened, it has to be flattened, and I am the one to flatten it if you don't mind. On to the next topic. See below :~
 
clylbw said:
There were finally ACTIONS today which had gone missing lately... :cool:

Thanks again for the tip on the tweezer bottom, SOCRATES; it got me in for the big rise from the beginning. :)

I would like to ask two things regarding today's NQ actions.
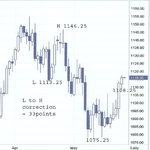
1. I made a mistake about a fake top :( . In the 10-minute chart as attached, I saw the 13:50pm doji as indicating the end of the 5 waves, illustrated by the pink lines in the attachment, and closed my long position. The next two bars seemed to confirm this, and I went short at the 14:20pm bar, highlighted by the orange line in the attachment. Obviously, this was a wrong decision; I covered with -0.5 points and went long again for the remaining of the up move. Did I overlook something or make some wrong assumptions which had lead to this wrong trade?

2. I remember Skim once said when watching the volume it is possible to know whether it is the retail or the big boy in charge. How may I do so? I believe knowing this will help to determine whether a high-volume bar represents a trading climax or not. For example, the 15:00pm bar in the attachment, indicated by the black line, looked like a potential buying climax to me, but the subsequent price actions indicated the opposite.

Thanks indeed. :)


Mechanical Explanation:~

Right then, let us begin:~

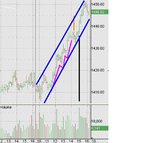
The chart you display contains 68 bars. The vertical cursor is on bar 27. I have no idea what the instrument is, and in any event it does not matter to me.

Look carefully - up to and including bar 29 there is a clearly defined support level at 1410 precisely. Look again. Up till here there is also a clearly defined resistance level above the action so far at 1419 /1420. Why ? This is accumulation.

Bar 30 drops to hit 1406 and recoils and closes at 1407.5. The volume under it is the highest volume recorded so far, is it not ? The next bar opens slightly above this close and drops to 1405 and then recovers smartly to close at 1412, a higher close than the previous close and
on lower volume. This is definitely accumulation.

Observe that these two bars have the lowest bottoms in the series. The price goes up and in bar 33 prods the underside of resistance1419/1420, and falls again, this time to bounce off 1412. Why ? Simple....first attempt is a failure. the price is brought back to 1412 and no lower. Why ? Simply there is no further supply.

Observe that in bar 38 the spread is narrow and the volume attributable is very small.

The price begins to take off, northwards, and the volume increases. The herd has been encouraged to join in. The price continues to motor upwards, the closings change in character.
The volume fluctuates and the price continues to climb. This is herd volume, sporadic, erratic,
timid, but nevertheless the trend remains intact.

At the top where you closed and exited there is no clue that the move has ended, on the contrary, all the clues are that it is likely to continue. It is the wrong place to go short. Why ?
Simple, there is no indication of a reversal. The price is very clearly supported at 34. Why go short ? Answer = impatience. Not imprudence, because you recognised the error and got out sharpish, with minimal damage which is good.

Now study carefully bar 37. The volume underneath RISES. The next bar has a higher closing with less volume. This is clearly a buying opportunity that smart operators are taking advantage of, isn't it ? This is very soon detected and two bars later the price begins to motor north again. This time the herd is more confident that the trend is still intact, but through dithering or not understanding what I have just explained, join in late, hence the added volume, instead of having tucked themselves in earlier.

When, at the top of this move the progress is temporarily halted again, they all get nervous and start to dither again. That is why at 1450 there are closes in the middle but the volume is mixed volume this time. This is not sufficiently grave for it to be a top. The top is not in sight yet. I should not be surprised to see this go another 15 to 20 units This is another buying opportunity for the bulls, should they wish to take it up.

They don't. Why ? They can see the top coming. It is too late for them to participate. They abstain. Hence low volume. OK ?

See the last bar is on low volume. Also there is a reluctance to drift back to lower prices, otherwise the volume would be heavy. Clear as mud, is it ?

The remainder of your queries have been answered very capably by Skim. I am not going over that ground again, we dont want overkill, although a huge tedious book could be written on this topic alone, I am sure these explanations suffice. That is all.

Others usual route please.
 
Last edited:
Check out the last major corrective wave from the Swing low on the 20th of April to the swing high on the 27th of April on the ES which = 33 points.

low on the 20/4 = 1113.25
high on the 27/4 = 1146.25
Difference of 33 points.

Now take the low on the 12th of May which hit 1075.25 .
Project 33 points up from 1075.25 = 1108.25 & we get the 1:1 resistance point.
If the market exceeds this level ( Overbalance) the trend will most likely continue in a new degree.

For the Gann SQ9 point..
Root 1075.25 = 32.79
33.79 + 0.5 for the 180 degree = 33.29
33.29 * 33.29 = 1108.25

I just take one day at a time, I don't care which way the market goes from here. :!:
I do care about the logical points of resistance & support the market will encounter on its merry way.These pressure points give either a conforming or non -onforming signal to act upon.

CJ
 

Attachments

  • ASIcorrections copy.jpg
    ASIcorrections copy.jpg
    47.6 KB · Views: 315
Last edited:
CJ

Many thanks ......................... much appreciated [and admired !]
 
Last edited:
Price and Volume

robq said:
Socrates,

Thank you for very impressive analysis.

RobQ

Agreed - Reads a bit like Tom Williams ( Wykoff like) ;)
 
Your Comments

I am pleased you like it. When the opportunity arises I shall do it live, futurology included, which is beyond Richard Wykoff and everybody else,
for your benefit and my satisfaction.
I Thank You.
 
Last edited:
i have a q.

what do you mean a320 by 1:1? i read most of the thread - c many refs but cant see the explanation. do u mean that the move is fractal? - the last move is the same point value as the one b 4 that?

thx

id be interested to understand scorates thoughts on position sizing - maybe another thread?
 
Thirteen said:
i have a q.

what do you mean a320 by 1:1? i read most of the thread - c many refs but cant see the explanation. do u mean that the move is fractal? - the last move is the same point value as the one b 4 that?

thx

id be interested to understand scorates thoughts on position sizing - maybe another thread?


What exactly do you mean by position sizing ? Explain more clearly for the benefit of viewers.
 
As a Wyckoff 'believer' I can appreciate the analysis..it's better than I can do....but, a couple of questions for anyone who wishes to reply

1."this is accumulation"...on this chart we don't know the instrument and we have no prior prices other than what we see on the chart..forget all the upward price movement which we can't see accept with hindsight..now how do we know this is accumulation and not say distribution ?..not being argumentative..it's a question and I don't know the answer

2."Observe that in bar 38 the spread is narrow and the volume small"...what information does this give us to trade or what conclusion is being implied from that statement ?..again I don't know the answer

3. Reference to "Bar 37" is Bar 47 for anyone who got puzzled,but the comments around it are valid

4."The top is not yet in sight"...how do we know that ?..I would have misread the heavier volume to indicate it was a top in the sense that I thought price continuity or persistence does not like over heavy volume (maybe it isn't TOO over heavy ?)...again I don't know why one interpretation rather than another although the two lower volume bars would have made me wonder

5."The bulls don't participate"...too close to dinner time to get involved ?

I would appreciate any experienced input on these questions..I would like nothing better than to master this type of approach and totally 'bin' all other aides.

Cheers
 
chump said:
As a Wyckoff 'believer' I can appreciate the analysis..it's better than I can do....but, a couple of questions for anyone who wishes to reply

1."this is accumulation"...on this chart we don't know the instrument and we have no prior prices other than what we see on the chart..forget all the upward price movement which we can't see accept with hindsight..now how do we know this is accumulation and not say distribution ?..not being argumentative..it's a question and I don't know the answer

2."Observe that in bar 38 the spread is narrow and the volume small"...what information does this give us to trade or what conclusion is being implied from that statement ?..again I don't know the answer

3. Reference to "Bar 37" is Bar 47 for anyone who got puzzled,but the comments around it are valid

4."The top is not yet in sight"...how do we know that ?..I would have misread the heavier volume to indicate it was a top in the sense that I thought price continuity or persistence does not like over heavy volume (maybe it isn't TOO over heavy ?)...again I don't know why one interpretation rather than another although the two lower volume bars would have made me wonder

5."The bulls don't participate"...too close to dinner time to get involved ?

I would appreciate any experienced input on these questions..I would like nothing better than to master this type of approach and totally 'bin' all other aides.

Cheers

View your private message inbox !
 
socrates - i mean how much to put on - how do you decide how many futures/shares to trade. my reason 2 ask is that i c u dont care much for common ideas of trading after reading all yr posts. i take it you dont do the old risk capital%/assumed risk of position = # of futures. eg $1000/ 5 ticks (@$10 a tick) = 20 futures where 1000 is the % of yr account u r willing to risk?


sorry if this is off topic.
 
Thirteen said:
socrates - i mean how much to put on - how do you decide how many futures/shares to trade. my reason 2 ask is that i c u dont care much for common ideas of trading after reading all yr posts. i take it you dont do the old risk capital%/assumed risk of position = # of futures. eg $1000/ 5 ticks (@$10 a tick) = 20 futures where 1000 is the % of yr account u r willing to risk?


sorry if this is off topic.

No, this is not off topic. When I was on the floor of LSE all sorts of formulae were concocted and bandied about for everything you can imagine.None of them work, because this activity is all about judgement, from an impartial posture as a consequence of experience.
Therefore you must take into account the condition of the market and what it can take.
The object of the excercise is to do your best to enter and exit unseen. This means that there
are times when you can deal size and not disturb the market and other times, for example, in "thin" scenarios that dealing size will have a temporary effect that could be detrimental to
your stoploss. You alone can never move it, at best you may cause a ripple, but you dont want this ripple to swamp your rowing boat do you ? no. Therefore be mindful of conditions and act accordingly.
 
thx. So u go on gut and market conditions (liquidity/volume & volatility?)

how would u advise someone with less experience than u 2 get a feel for how much 2 put on - trial & error?
 
Thirteen said:
thx. So u go on gut and market conditions (liquidity/volume & volatility?)

how would u advise someone with less experience than u 2 get a feel for how much 2 put on - trial & error?

You need time for this. Watch carefully without blinking and soak it all in, noting your results.
Recognise when you are right and when you are wrong and why.
Experience is a process we all undergo. It consists of making mistakes,
but benefiting from them by not repeating them.
 
so there is no rigid method - just put on size accoring to how confident u r?
i could say i am always confident other wise i wont put on a trade. so if i put all my money on the position, i will soon b bust after a small drawdown. i dont understand. guess i must think a bit more on this 1 by wot u mean
 
Is there not merit in seeing the upward move like this?
 

Attachments

  • clbw.JPG
    clbw.JPG
    69.5 KB · Views: 286
The trend lines you show

Rognvald said:
Is there not merit in seeing the upward move like this?

Yes, there is a lot of merit in seeing the upward move like this, and your illustration is
technically perfectly correct.
However, when you channel a move in this way by putting on trend lines physically, you distract
your attention from the action.
If you do not put on the trend lines physically but instead carry them in your mind's eye, that is,
you imagine them, your attention from the action is not distracted. That is the bonus.
This is opportunity cost. It means going without one thing in order to have another.
 
Last edited:
Top