'No indicators' revisited

  • Thread starter Thread starter ford
  • Start date Start date
  • Watchers Watchers 53
mombasa

a cupl of me mates - laid off during 2001-02 r now in the final stages of their interviews with some major banks - however the pitch at the mo seems 2 b - ok let's c what the situation with the bonuses is gonna be like, and depending on that some hiring freezes may be dropped etc..... which - imo - does not change the fact that as it stands now LOADS of good City traders r being wangled about really.... just too many good ppl to choose from.... just my observation of coz
 
Mombasa

Thet're probably just bullish 'cos they want to earn a commission.
 
Volume query.

RE. YM..5 min. charts

The 9-40 9-45 9-50 "sell" bars on Mytrack showed increasing vol. while on IB it showed decreasing vol!!

Any ideas which is correct and does this discrepancy occur often?
 
Dont trust volume on IB which is a country mile off reality and I know because I have done datafeed comparisons. That said Mytrack may be no better but others may know better than me.


Paul
 
Last edited:
Volume

Thanks Paul

I have heard one co. kindly referred to as
My crap, but did not know about tuther.

Thanks again

Ken. T.

PS,can anybody advise where reliable vol. data can be obtained for YM ?

Thanks
 
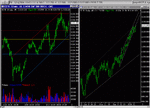
King size bear flag took its time delivering but exceeded its target as the lure of S2 pivot (and previous support) proved too enticing. A long off S2 a reasonably safe entry but tings were moving very fast and it would be easy to miss. Spook out of 0.75 point below support didn't help but manageable if you normally use 1.5 pt stops (the minimum I'd consider on ES unless scalping. But remember I am inexperienced and may well be wrong about this).

From here? No idea, but I'm beginning to feel ursine glee welling up.
 

Attachments

  • clipboard.gif
    clipboard.gif
    28.1 KB · Views: 766
Last edited:
Momentum Bars

I do realise that there a no rules as such in this game, but I have a few questions regarding the above mentioned....
Are they an indication of a change in momentum or are they best used as a confirmation that the trend is still in place and perhaps strengthening?
Can they be used as an alert to the possible break out from congestion?
Should the higher high/lower low which has been created above/below the previous two bars be a minimum number of ticks beyond these, in order to add strength to the momentum bar?
Hope these questions are clear enough for someone to help. 🙂
Cheers
Quercus
 
Reasons to short 1136

R1 pivot
top of 10m channel
Potential completion of 5 wave from second 1114 low
5th wave similarly sized to the 1st wave (from 1114 to 1127.75ish) [?valid]
Double resistance on daily chart (lines of best fit allowing)

Initial target 1133 (standard bracket order used at strong sup/res is buy/sell limit at bid/offer, stop 1.5, target 3. If that doesn't get filled in a few seconds I'll go for a market buy/sell if confident)

Target was passed quite quickly, then ES bounced to form a lower right shoulder, which scared me into moving stop to breakeven -0.25 (pay commission? never 😀 )

Fortunately the shoulder failed without a retest of the high and I felt privileged to cover near the red dotted line for 5 points. I was painting the hall at the time which stopped me fiddling with limit orders to cut profits as I often do. So Frugi is very pleased with today's single trade, especially as china says 5 points is a good haul even for a pro, given current low volatility.

I missed the long at 1123 about 40 mins into the session. Yes, S1 was there but of course the channel bottom wasn't and those 4 savage momentum (cheerz for explanation earlier Sk) bars on menacingly bloated volume scared me. Had I stuck on a Fib ladder I would have seen that 1123 was roughly a 50% retracement of the 1114-1133 move but I forgot to.

Arbitrary indicators used: 0 (even TICK received the flick) Wahey, this I like.

However consistency still eludes Frugi which is one reason why he bores you with this homework every other evening. Sure, them bars may slowly be emerging from the mist, their intentions and direction occasionally clear, but, equally often, they are indistinct and capable of formidable betrayal. Hey, perhaps I turn pro next year hmmm work to be done there...

PS Yo! a320 , I miss yuor geometry lessons! (And people have to put up with this meanwhile!)
 

Attachments

  • clipboard.gif
    clipboard.gif
    29 KB · Views: 587
Last edited:
Darksider's,
Was watching price action only today on both Dow + ES, and I have a Q that I hope someone can help me with.
Looked like a dbl top approaching on ES at 1730 ish ( GMT )
at approx 1134, but noticed the Dow still 40 - 50 pts below it's dbl top.
Sure enough Es continued up until Dow hit it's dbl Top (almost ) and then both retreated.
Is this a common occurance that I should remember for the future?.
If I had been trading the ES was there any action that would have stopped me taking at short at the dbl top on ES .
Thx,
hampy
 
Post's crossed.
Thx Frugi. I enjoy reading your homework 😀 , but If I print off many more I shall be out of black ink! :cheesy:
cheers,
hampy
 
No worries folks 😀 Just remember I don't know arf what some folk on ere do. I apologise for the confounded black cartridge bankrupting background - I've been meaning to do one in magnolia for a while. Next time I promise!
 
hampy,

Yes it is quite common.

Nothing wrong with with taking the short at the double (or triple top, since it was at yesterday's high). I didn't see anything that stopped me. The fact that it was YD high + high of first hours range + an up-move that lasted over 1.5 hours + it was on the bottom of the hour all made it look like a reasonable trade to me.
YES, it was a counter-trend trade so I ran it tight and there were lots of chances to get out of it at scratch or slightly worse.

Anyway, I'm not going to beat myself up about it. I just take satisfaction in the way I got out of it and move on. Hey, you can't be right all the time.

I'd still be interested if Skim or airbus 😉 have any insights though.

Oops crossed posts again.....
 
Elliot Wave/Fibonacci

I am after some help with regard to Elliot and Fib retracements please! 🙂
There is a much higher probability that my take on this is completely wrong as opposed to vaguely right, however I am keen to learn.
I am really trying to keep this simple and like Skim's approach to EW - ie. 5waves up/down, maybe 3wave corrections and if you can't see 'em then don't look! :cheesy:

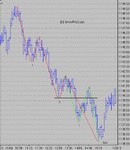
HOWEVER, it's not always that simple as usual! Someone mentioned a 7wave move the other day (can't remember who and no matter), but I was thinking about it a little and would like anyone's opinion on the attached chart please. Is this reasonable/correct? Is it correct to re-number the extended 5th wave because it has retraced beyond peak3? Should you always stop at 5waves?

Enough of that and on to Fibonacci - Are there any general levels of probability that relate to the range of retracement? What I mean is this. Do you see x% of retracements reach 38.2%? Do you see more retraces to 50% or even 61.8%? What percentage of retraces will stop at 100%? Those that go beyond 100% seem to get to 127%. What proportion will stop here? I could go on forever and bore you all to death so I'll stop, but I hope my query is clear.
I find these oft repeated wave patterns and retracements truly fascinating, and very useful in setting mental alerts as price approaches them! Any further information will be greatfully received, but do believe me when I say that I'm trying to keep it simple! 😉
Cheers
Quercus
 

Attachments

  • screenshot001.gif
    screenshot001.gif
    13.5 KB · Views: 643
Last edited:
Sometimes they do 7, I've seen 9 ages ago.( 300 point rise!) Like everything, take what you know works and that is 5 . If you've counted 5 and you get out, you won't be far off, except in rare cases.
 
Quercus

I do'nt believe it............"there are general levels of probability that relate to the range of retracement"

markets frequently retrace approx 3/8 1/2 and 5/8. These are good areas to trade but just like elliot's waves the fib retracements are best seen after the event
 
Quercus

Skim is right, they can get very complicated.
The main problem is that waves can sub divide and 'extend'.

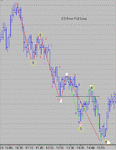
I have had a go at your chart and put in some detail for you.
I'm not sure it will help at this stage but it may explain what happened.

1 & 2 seem ok.
3 waves usually extend and are the longest.
I have put in some detail on the 3rd

I don't know of anyone who trades elliott because you can seldom label a wave until after the event.

Lots of fun though

😆
 

Attachments

  • spwaves.gif
    spwaves.gif
    10.5 KB · Views: 663
ChartMan said:
Sometimes they do 7, I've seen 9 ages ago.( 300 point rise!)


And when you see a big circle its got 450 degrees ???

Whatcha been smokin Chart Man ? { its NOT legal }
 
Back
Top