zupcon
Experienced member
- Messages
- 1,162
- Likes
- 322
Let them be JEALOUS of your SUCCESS.
Thankfullly I'm such a failure, that I dont need to stoop to spamming forums begging for donations 😆
Let them be JEALOUS of your SUCCESS.
Thankfullly I'm such a failure, that I dont need to stoop to spamming forums begging for donations 😆

Meanwhile, pips were being take from the short at 0.6550
TRO, am I right in thinking, on eur/usd this hour that there was a Long trade first at 1.2725 that would have been good for 10 pips, and now a short at the break of 1.2700 for at least 10 pips. The opening price was 1.2719.
Do you take both the long and the short in this scenario?
Many Thanks again
Bunny
and of course pips where being lost from the eurusd long at 1.2725.
We could play this game of retrospectively posting good and bad set ups, but I'm not sure how this actually helps anyone
Even you said there is only one trade per hour.
Stick to the rules.
According to IGindex we just had our 3rd Red candle in a row on EUR/USD...the highest one looks like a doji but actually closed 1 pip lower than the open making it a red bar. So according to your other method TRO we should be looking for long eur/usd trades now?
Bunny

and of course pips where being lost from the eurusd long at 1.2725.
We could play this game of retrospectively posting good and bad set ups, but I'm not sure how this actually helps anyone
I wonder if the difference here is that I am waiting for the BID price to cross the line...that's why I have been entering at 2 pips past the line for example: 1.2627 (1.2625 + spread) I do this because if you're going long at 1.2625 then the chart will still only be showing 1.2623 so you're getting in too early. If you had waited another 10 minutes before entering when the bid price hit 1.2625 you would have got your scalp
Bunny.
TRO, am I right in thinking, on eur/usd this hour that there was a Long trade first at 1.2725 that would have been good for 10 pips, and now a short at the break of 1.2700 for at least 10 pips. The opening price was 1.2719.
Do you take both the long and the short in this scenario?
Many Thanks again
Bunny

The Rumpled One:
"LIFE IS TOO SHORT TO WASTE TIME IRONING CLOTHES, SO MY T-SHIRTS ARE RUMPLED."
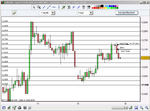
Please post a chart so we can see what you are looking at.
Thanks.
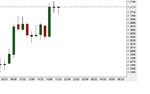
This is the bar that I was looking at that would have been profitable for both long and short.
Bunny
p.s I'm sorry I havn't worked out how to upload tinypic yet, I hope the chart is big enough.