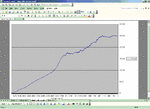
Nasdaq Daily Breakout

dax is good when trading daily breakouts.. eg exceeding previous days high/lows.

BUT. the problem of that is that you end up getting false signals at worst, or at best considerable slippage on gaps.

ive never been too keen on the Dax. its long hours make it a bit like forex, but without the huge spike moves..

tends to wander around for long periods too.
 
horses for courses FC. Never traded daily breakouts (sometimes the opposite) but for me anyway with my EOD style its always been pretty reliable.
 
interestingly enough..

trading on the short side only produces similar results to going long.

added benefit is that you arent paying the daily carry for longs.

bit too many flat periods though.


i suppose this shows 2 things.

1)entry is largely unimportant - where this seems to work is the cutting of losses relatively short.

and

2) down days happen with increased volatility.


fc
 

Attachments

  • short only equity.gif
    short only equity.gif
    26.4 KB · Views: 258
What happens if you have one account for shorts and one for longs and trade both at the same time?
 
Bigbusiness said:
What happens if you have one account for shorts and one for longs and trade both at the same time?

Or if your trading via SB you could go long on the cash index and take a short on the
June Futures , using the same account..
 
wouldnt you rather go short the cash and long the futures?

other wise you are being hit for both the fair value decay, and the rollover charge?
 
FetteredChinos said:
wouldnt you rather go short the cash and long the futures?

other wise you are being hit for both the fair value decay, and the rollover charge?

Ahhhh Good thinking !!!!!!!!!!

But would it work ?
 
only one way to find out..

i dont think it would work. well it would, but not as intended.

quite a large portion of the profits come from the Reverse part of the trade.

so say we were short cash and long futures..

futures got stopped out. and reverse.

so effectively we are short on both the cash and the futures at the same time.

double the exposure, and double the dealing costs.
 
FetteredChinos said:
only one way to find out..

i dont think it would work. well it would, but not as intended.

quite a large portion of the profits come from the Reverse part of the trade.

so say we were short cash and long futures..

futures got stopped out. and reverse.

so effectively we are short on both the cash and the futures at the same time.

double the exposure, and double the dealing costs.

So you may as well double your position stick with longs and save the spread .
 
aye.

:)

just gotta accept losses as part and parcel of any method.

nearly got stopped and reversed this morning on FTSE, but it seems to be recovering..

will give this one a couple of weeks to see if it at least breaks even after spreads..
 
FetteredChinos said:
aye.

:)

just gotta accept losses as part and parcel of any method.

nearly got stopped and reversed this morning on FTSE, but it seems to be recovering..

will give this one a couple of weeks to see if it at least breaks even after spreads..


A couple of weeks !!!!!

I am sure you will have a few more systems by then ...

Keep em coming

Ian
 
FC,

I am a big fan of mechanical 'set-and-forget', approach to trading.
I am following this, and some of your other threads with interest.

I have attached the analysis on GOOG (Since Launch), MSFT (2 yrs) , and EBAY (2 yrs), using your original spreadsheet (data from Tradestation).

GOOG was great as it ran up to $200, but since chopping around, it has not been profitable.
MSFT was consistent, but account equity has gone largely sideways the last year.
EBAY was the best until it's recent $5 gap down.

The EBAY example got me thinking. What if we you reversed the rules if the share/index/future was below the 34 ema? So essentially go short at close and SAR long, if the stock price is trading below the 34 ema, and reverse for above. It would have turned the $5 gap into out profit, rather than a loss.

I'm not trying to fit a strategy to an example of 1, the logic behind it is that when above a 34 ema, you are likely to get more green candles than red? Thus, less SAR trades. Reverse for below ema.

Hope this helps.

Regards, Dave.
 

Attachments

  • long every day (GOOG MSFT EBAY).xls
    967 KB · Views: 268
  • ebay.jpg
    ebay.jpg
    159 KB · Views: 226
interesting thoughts there DG. i will have a tinker with SMA's etc so that the orders reflect the short term trend more.

im more wary of trading something like this on individual stocks as they tend to gap more often.

you dont tend to get 5% gaps on the indices very often, not least without the futures giving you a chance to hop on board, as least part of the way down.

will have a ruminate in private though...

;)
 
just had a look at your sheets..

your Ebay data was in backwards i think.

i rejigged it, and the equity curve doesnt look too bad now. despite the huge drop.

you may want to recode it.

the others look ok though :)

still not as good as the indices..
 
FC are you entering at the market close using the SB firm's futures price. My reading of these idea is you would ideally go long at 16:31 on the FTSE, 21:01 on the DOW. Is this correct?

I also guess you add the 2pt SB spread onto the ADR to trigger a reversal?

Thanks,
Gizmo
 
yup thats the one..

though on the FTSE i wait until 16.35 or so, as that is when the auction period closes.

give or take a few mins.

think the Dow settles at 21.02 or 21.03

i wouldnt trade normal size on this until you are sure it works.. :eek:

probably wont in real life, but thats what im going to test for a while..
 
Cheers FC.

You have posted loads of interesting ideas which I am reading through. Do you use any of these for real following live forward testing?

Gizmo
 
currently trading the here's another one GBP/USD strat for real.

performing roughly in line with backtesting.

am also, and have been trading for some time, a version of one of my FTSE strats i published on here long ago.

essentially buying and selling the FTSE when correspondingly cheap and expensive, and holding until a suitable exit.

averages just over 10 points per day, but the intra-trade drawdowns are a bit hair y.

hence my pursuit for something a whole lot simpler...

Eurostoxx might be worth a further look for all sorts of ideas though. it is one trendy bugger (open-toed sandals and everything)

fc
 
Top