FetteredChinos
Veteren member
- Messages
- 3,897
- Likes
- 40
Afternoon all,
been trawling through the posts back on the Contemplating Trading Strategies Board on the Motley Fool.
rediscovered the JT Daily Breakout over on there, originated by our esteemed colleague Mr JonnyT
basically, the simple rules are go long when we break yesterday's high, go short when we break yesterday's low.
close all trades at the daily close.
using data from livecharts/dukascopy, i have been testing this on various indices.
they all work reasonably well, but recent performance has been a bit stodgy.
APART from the Nasdaq-100.
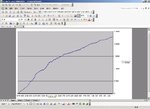
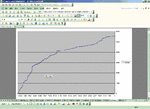
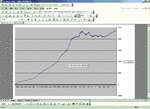
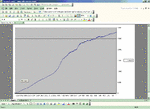
on the data i have, testing it from 1990 to present date yields a frankly astonishing 12133 Big points, or 121,335 points when spreadbetting....
this equates to approx 35 per trade. LONG TERM AVERAGE 😱
with a win rate of 57%.
only problem is the drawdown, which at the height of the bull market hit 784 big points (7840 tradeable points).
since then, for the past 4 years, the max drawdown has been in the region of 200 big points.
much more bearable.
i've only been testing this on OHLC daily data, but frankly, even with a few "funnies" in the data, it looks pretty healthy.
could someone please test this on intra-day futures data, just to check that the entries are indeed feasible and dont get whipsawed to death?
ta
FC


