Demo account
Long Paccar
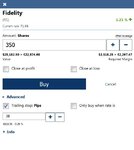
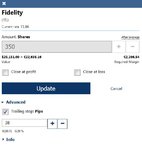
650 Shares
Reason of closure: trailing SL got hit
Opening rate: 55.02
Opening time: 6/22/2016 4:22 PM
Close rate: 55.00
Close time: 6/22/2016 5:33 PM
Amount risked: € 126.28
Initial Stop loss: 22 pips = 54.83
Net P/L: €-11.53
Chart
Green arrow is where I opened position and red arrow is where it got closed. Chart is a 15 min chart.

Personal notes
A lot of losing trades right now. Went up after it went down again so could argue the validity of the system (tight SL's) but that's the whole idea behind it this is for figuring out if it's valid or not.
Also here is the hourly chart. What I am looking for while scanning stocks looks like what you see in the orange box.

Long Paccar
650 Shares
Reason of closure: trailing SL got hit
Opening rate: 55.02
Opening time: 6/22/2016 4:22 PM
Close rate: 55.00
Close time: 6/22/2016 5:33 PM
Amount risked: € 126.28
Initial Stop loss: 22 pips = 54.83
Net P/L: €-11.53
Chart
Green arrow is where I opened position and red arrow is where it got closed. Chart is a 15 min chart.
Personal notes
A lot of losing trades right now. Went up after it went down again so could argue the validity of the system (tight SL's) but that's the whole idea behind it this is for figuring out if it's valid or not.
Also here is the hourly chart. What I am looking for while scanning stocks looks like what you see in the orange box.


