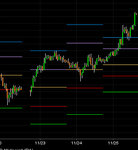
More details on my overstretched system
After all the talking about the requirement of going up for >24 hours and going down for >12 hours, we must absolutely define what we mean by that.
ENTRIES:
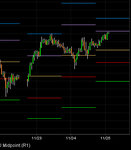
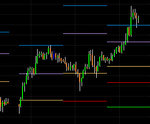
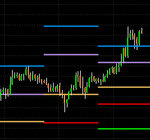
Set up a month of hourly candles with pivots on EUR FOREX
Enter long/short at 8 AM/PM CET based on these 3 requirements:
1) overstretched in ticks (>100 ticks top-bottom)
2) overstretched in hours (>24 hours going up or >12 hours going down)
3) pivots (near pivot line)
EXITS:
1) Stoploss at half a pivot level away
2) Close position after 12 hours, and enter the next trade (unless the requirements are not met).
To do so, we first of all need a definition of top and bottom. Hopefully a univocal one. Because otherwise we'll be like when we talk about trendlines, whereby you can adapt them with hindsight.
Also, I am feeling the need for this, because I was wondering whether today I followed the requirements of my ever-changing system.
Did we have >24 hours of going up?
It's simple: we have to count 24 candles from the bottom. But then again what is the bottom? I know the 24 candles are there, because I just counted them, but I need a univocal way of counting them. I need to define what it is that I just did.
WHAT IS THE BOTTOM?
Bottom is, much like easylanguage defines it, the
lowest low of x periods, but it is NOT just that, at least in the sense I want to define it. In my case, since I want it to go up for 24 hours, and down for 12 hours at least, then it must be the lowest low of the last 12 hourly periods/candles all right, but that's not enough. Because in the past 12 hours we could be going up 5 hours and then down 7 hours and we'd be at the lowest low of the last 12 periods, but we wouldn't be going down for 12 straight hours, which is exactly what I need to try and define univocally. Both in order to later test it, and in order to not fool myself with hindsight.
So, how do we define 12 hours of straight falling (and therefore
bottom), rather than the
lowest low of the last 12 hours? We could easily say that requiring all those 12 candles to have lower closes is a guarantee of bottom, and that is correct. But it would be too strict of a requirement, and it would happen too rarely. This is one of the reasons that I could never backtest this system properly. Because I never got down to defining this concept.
Ok, solved. I don't need to worry about how the 12 hours evolved, because I also have the >100 ticks requirement. So this thing comes out to be like this:
NEW OVERSTRETCHED METHOD
Set up a month of hourly candles with pivots on EUR FOREX
LONG ENTRY:
If at 8 AM/PM CET:
1) we're >100 ticks
lower than at 8
PM/AM CET, and
2) we're close to a pivot line
Then enter LONG
SHORT ENTRY:
If at 8 AM/PM CET:
1) we're >100 ticks
higher than at 8 AM/PM CET, and
2) we're close to a pivot line
Then enter SHORT
EXITS:
1) Stoploss at half a pivot level away
2) Close position after 12 hours
Now, before backtesting this thing I still need to find out very very strict definitions of pivots. Because i've explained how pivots on futures do not work, and yet I only have futures data. So I am screwed to begin with. And even if I had the good forex data, it'd be a real pain in the ass to test with two data sets. Bottom line: I will probably never backtest this thing.
