Best Thread My Journal at a Prop house

Hi Guys,

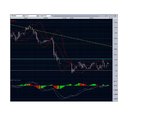
Caught a Glimpse of a few posts on Pocrels Journal (check it out) about a USDCAD trade and had a little look at it myself. While its not a well defined range price is defiantly consolidating and drifting sideways and ive marked off the extreme boundaries.

attachment.php


I also fibbed from the low to the furthest point of the retracement and price just creeping to around the 50% level and reacting off it to give me the base of the range. While its not the most clear cut setup I’ve posted it’s definitely a location of support and I fancy a little naughty scalp if price gets down there again.

A break of it and I can get short as price will be making a lower low and have broken out of a narrow band of trading and a bounce can give way to a long as price is at a 50% retracement as well as support in a range.

So just have to wait and see.
 

Attachments

  • UC.bmp
    1.6 MB · Views: 910
Price pulling back on cable from this mornings sell off, Fibbed form the high to low and looking for at least a 50% retracement and then will be looking to get short.
 

Attachments

  • GU.bmp
    1.3 MB · Views: 189
Last edited:
OK so here is a question. To me the EURUSD is in a range, been going sideways this week after last week falling out of bed (and out of a wedge - in yellow) after Friday's fun and games....

My question is this - where do you mark the lower bound of the range? Around the most recent low (roughly 1.1900 - green) or around the one before that (around 1.1875 - purple)?

I have the upper bound at 1.2009 (blue), but the lower one is harder. Obviously it comes down to a matter of personal preference, and watching further developments around those levels, just interested to hear opinions....
 

Attachments

  • eurusd.JPG
    eurusd.JPG
    140.7 KB · Views: 197
The range would be low 1.1875 and the high. To me i would be put the range like this. A range dependant on time. This is just my preference and by no means right. I get two touches of the bottom line and two touches of the top.
 

Attachments

  • eurusdrange.bmp
    1.6 MB · Views: 167
OK so here is a question. To me the EURUSD is in a range, been going sideways this week after last week falling out of bed (and out of a wedge - in yellow) after Friday's fun and games....

My question is this - where do you mark the lower bound of the range? Around the most recent low (roughly 1.1900 - green) or around the one before that (around 1.1875 - purple)?

I have the upper bound at 1.2009 (blue), but the lower one is harder. Obviously it comes down to a matter of personal preference, and watching further developments around those levels, just interested to hear opinions....

Hi Rosehound,

Yeah mate pretty much everything is range bound at the moment very sidweways week so far. For that EU top boundary is spot on I got mine in at the same place. The best way I find is to mark off the previous swing high and the previous swing and use that to define your range. If price makes a false breakout then you move the boundary to the false break high/low. So for EU my lower extreme is at 1.1875.
 

Attachments

  • EU.bmp
    1.2 MB · Views: 176
Cable for me is a little more unorthodox but still this is how I see it.
 

Attachments

  • GU.bmp
    1.4 MB · Views: 175
Cable bouncing off that upper trend line and making a lower low so will be looking to get short.
 
Cable bouncing off that upper trend line and making a lower low so will be looking to get short.

Mate, ive been looking at GBPAUD. I think the overall trend is up, but i think it will be looking to test the bottom trend line again. I think we may see a cable rally later today, which will break the wedge pattern you have drawn in your in your chart. Also sentiment is that GBPUSD is cheap and EURGBP should push lower, but we'll see. All this is telling me that GBPUSD may sell off for the time being.
 

Attachments

  • gbpaudtrending.bmp
    1.7 MB · Views: 149
So cable breaking to a new high a voiding the short, So im now going to trade this as a breakout waiting for a pullback and then will look to get long
 
Thought I would add a screen shot of this setup. This is my 3m entry timeframe on cable. Price was right at the top of this diagonal resistance made a LL so I was looking to get short as price was telling me resistance has held. The short never triggered and price then broke to a new high and through the resistance level so I waited for the pull back to get my long entry which has just triggered . S/L is at 1.4475
 

Attachments

  • GU.bmp
    1.4 MB · Views: 229
and there she goooesss. Scaled out at 1.4515 so now what ever happens locked in a small profit and still got 1/3rd of the position on.
 
and there she goooesss. Scaled out at 1.4515 so now what ever happens locked in a small profit and still got 1/3rd of the position on.

Stop moved to 1.4485, would be nice to get a bit of a run here. (y)
 
Im going to keep trailing my stop up on cable behind the swing lows but have a target in mind of 1.4555 which is just shy of mondays high.
 
Just keeping an eye on EU here as it is coming up to the resistance at the top of the range I posted this morning.
 
EU just popping out the top of the range, waiting for the pull and a long or a turn around and a short. Its all go at the moment. :D
 

Attachments

  • EU.bmp
    1.2 MB · Views: 173
Top