my journal 3

Done with the third lesson of this tutorial:
Advanced Placement (AP) Statistics Tutorial

I've looked at it again and this is a statistics tutorial, so that is why I am not seeing any probability theory. It's very long, with dozens of lessons. It will be more than enough for me, combined with khan academy. But now I also have to find a probability course, which I will complete side by side. So I'll have these three things at once: review exercises at khan academy, statistics tutorial, probability tutorial. And even then it might not be enough to understand the first five pages of Markowitz's paper. But the fear of formulas is gone, and that was a great achievement.

[...]

Ok, I found this:
http://www.mathgoodies.com/lessons/vol6/intro_probability.html

It seems crappy, with ads and all that. But it's not. It's comprehensive, it has clear explanations and interactive exercises (with immediate solutions, not on a .pdf file).

For now this is all I can really afford in terms of eyesight: khan's review exercises, stat trek's stats tutorial, and this probability tutorial. After I finish all of this, I'm going to review summation notation again, and then give it another shot at understanding markowitz's paper.
 
Last edited:
Ok, I couldn't fall asleep so I did one more probability lesson here:
Certain and Impossible Events

This was easy, but easy is the right pace for me, because as far as math I had the habit of doing nothing at all, so easy is the best way to keep me motivated. Besides, probability tends to get complicated very quickly so we better start easy.

Livin' In A Van Down By The River - Matt Foley Motivational Speaker - His Full Scene - YouTube

SNL The Gap Girls. Complete Episode. Sandler, Farley, Spade - YouTube

(MUST SEE) Snl Funniest line ever with chris farley and will ferrell - YouTube

Chris Farley interviews Paul McCartney - YouTube

Ok, I've done one more since I still could not sleep:
Sample Spaces

This is easy but step by step they're teaching me stuff I would have never learned in those 350 pages .pdf I could find online, such as these two:
A Short Introduction to Probability
Sorry, I am not going to read 127 pages from start to end. I'll use this as a dictionary when I have doubts.

And this is 500 pages:
Introduction to Probability
You throw at me a 518 pages book and call it "introduction"? You are provoking me. There better be everything on probability in that book.

These guys take it from very far away, and first spend 10 pages dedicating the book to wife and children, thanking all their colleagues, and writing footnotes and bibliography. That's why I am instead grateful to those websites that sum it all up, and give me some exercises to keep me from falling asleep. Oh, good: I could read that book to fall asleep.

Among the other things, I just found out, from answering a question on "sample space", that 1 is not a prime number:
Why is the number one not a prime?
 
Last edited:
The immense amount of work I did for the investors, that made me lose my eyesight, served some purpose. Now I can very quickly check every possible consequence of any system, but I must not make the same mistakes we made. The combination I chose loses a lot more than I had hoped, and I will keep it that way: I won't try some hyper-optimization to find a combination that miraculously works, makes a lot of money, and has a small drawdown because the profit of a system compensates the losses by another.

In other words, I just checked the combination of 4 systems I am meaning to trade at the end of this month, and here's the bad news:

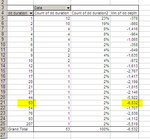
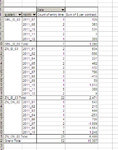
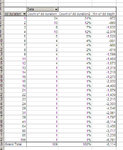
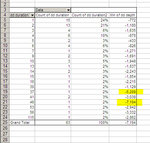
dd_duration.jpg

Historically they have lost 6500 at their worst. Now i clearly do not have enough capital to withstand that kind of loss. But this is not it, because there's the relativized drawdown to check, which is the drawdown adjusted for today's prices: 7300.

Not too bad. Not much worse.

Forward-tested loss of the last six months (two of the systems have only traded for six months) is 1000 dollars.

If things went as well as forward-testing, then I'd be ok.

Let's see how often the 6500 dollars drawdown happens.

By the way, what I said for a year was confirmed: don't make me create too many worksheets because they will be incomprehensible and the maintenance impossible. And this is what happened. I've got every imaginable statistic in here, but it's now become a labyrinth. I'm going to hide some of the sheets I don't need.

Ok. In 10 years, the drawdowns above 3k happen only 4 times.

profit.jpg

That means once every two and a half years. What is the chance that they'll happen as soon as I start? Small.

But this is not good enough. Now I won't look for the magic combination, but I'll look which system makes more, and then use that one. I can't use all 4 with the little capital i have.

performance.jpg

There. Much better. There's two systems that make all the money. Let's see if this is the case also in forward-testing.

ft_perf.jpg

Yeah. More or less.

So ok. Let's say I discard those other two.

It's terrible. There's one drawdown of 8k. Other than that everything gets better. Now let's try to not engage in portfolio curve-fitting, because I'm dangerously getting close to it, if it weren't that I am just removing systems.

Ok. Good thing I did this. I removed systems... one systems that is not that good in back-testing, NQ_ID_03, even though it is excellent in forward-testing. To be safe this must be done. It's not the 20 trades of forward-testing that are going to make it an excellent system: ten years of back-testing do count.

Furthermore, GBL_ID_02 is excellent in back-testing, so I've decided to keep it. It doesn't do any damage to the portfolio (this sentence sounds like curve-fitting of the portfolio once again, but I'll move on).

those_3.jpg

These 3 left did excellent in back-testing and forward-testing. Have a low drawdown, and a low margin requirement. High sharpe ratios (between 2 and 5, depending on system and forward-testing vs back-testing performances).

The only problem is that once every 10 years, they lose 8k. And I don't have 8k, but I'll do it anyway.

They make about 5k per year. Enough to pay for the server and build up some capital.

I am going to monitor this combination of 3, and I will enable it at the end of this month probably, expecting about 1 trade per week. I can't do anything else. I can't wait a year without doing anything, and I can't do anything with the bargaining friend, because I'd get more troubles than capital.

[...]

I'm going to add ZN_ID_06 as well. These four I will monitor for the next four weeks. They practically did not have one negative month in the past year.

[...]

I woke up and went right back to it, and found out that NQ_ID_03 belongs to a group of systems, together with its ES and YM equivalents, that has worked great in both back-testing in forward-testing. So despite the fact that the specific system has not done well in back-testing, since the code works on ES and YM, I will still use it. Also because it's the one that worked best in forward-testing and because it's the one with the least leverage.

These 5 systems mentioned should bring me over 1000 per month, unless I am unlucky and incur the big rare drawdown immediately. With over 1000 a month, in a few months I should be far away from the risk of blowing out. Once we hit a capital of 10k, I can add the NG_ID_02, which will double the monthly profit, and soon thereafter the EUR_ID_05, which is the next best system in line.

To trade this combination safely, I would need a capital not of 4 thousand but 10 thousand dollars. But I don't have it so I'll have to push my risk, and hope that the worst drawdown won't happen immediately. Otherwise it would take me... 1 year to save that amount (considering 300 euros saved per month, which is 400 dollars, and including the bonuses). If I don't wait that long instead, start now and don't get unlucky, I'll reach that "safe" capital in 5 months, at which point I add the NG_ID_02 and sail away from danger.

The other idea was to let my bargaining friend in, and that way we'd have about 9k, but he keeps on bargaining and disrespecting me, and I'd be prisoner of this relationship for years, so I better not even get started, especially with such a poor start.

THE DOORS - People are strange (1967).MPG - YouTube
 
Last edited:
Probability work done for today:
Complement of an Event

Statistics work looks like it will be harder today than in the past few days:
AP Statistics Tutorial: Measures of Variability

I will do it after or while I'll finish watching these two movies I've been watching:
Watch License to Drive online on LetMeWatchThis
Watch This Must Be the Place on LetMeWatchThis

[...]

Ok, done with statistics, too. It seems to me that (only as far as what I have covered in my simplified courses) in statistics there's a lot more glossary to learn, and in probability there's a lot more understanding involved.

Today I came across the "n-1" problem once again, and I tried to get to the bottom of it, but still didn't manage to. In other words why does the variance and standard deviation of a sample (vs that of a population) get divided by n-1 rather than by just n? Salman Khan answers it here, at minute 7, but I still have not understood it completely:
Statistics: Sample Variance | Statistics | Khan Academy

I will work more on it tomorrow. Ok, so the reasoning should begin with what the variance is, which is the average squared deviation from the mean. So my question is why do we remove one element when calculating this average squared deviation for the sample? Salman says it's because in a sample it's more likely that variance gets underestimated relative to the population. Why? Why isn't the chance of overestimating it just as high as the chance of underestimating it? Tomorrow I am going to do a lot of tests on excel and see if I can figure it out.

[...]

I've done some tests on variance. So far it seems to me that excel's "varp" function (regular "n" in the denominator) used for the sample provides a better estimate of the population than "n-1" ("var" function in excel):

View attachment tests_show_n_better_than_n-1_for_sample_as_well.xls

I will need a lot more testing, because there's a consensus that "n-1" for the sample is better, confirmed by excel's use of "var" function. But then again, excel is the one that says that -2^2=4

4yr old girl calls 911 for help with her math - YouTube
 
Last edited:
Done daily review exercises at khan academy, done probability, done statistics. Today I studied z-scores, among the other things. And I found out that on excel you can use the "standardize" function for it. Many new doubts and questions, but knowledge and understanding keeps increasing.

At this point I've gotten quite confident so I am attacking simultaneously math from all sides: brightstorm.com, khanacademy.org, wikipedia, stat trek, excel, and others. I am using so many resources to answer my questions, that it's a pain and not efficient to list in a post all the work done. So from now on I will just say that I've done my daily math, and maybe mention some of the stuff I've done. Yes, because the point of writing it here in front of everyone is, rather than listing what I do, to make myself do the work. So, if one day I'll write "i haven't done any math in weeks", that will not sound right and I'll try to avoid writing something like that. But since I write the truth, then I have to do math.

I hope that khan academy didn't stop giving me review exercises just because I wrote them a question about how they're assigned. I think it's all automated but you never know. In the last few days, in their developer's "issues" message board, I asked if we can be told what are the parameters that decide when and which review exercises are assigned to us. None of the developers replied (just some other regular students-users like me), but today no exercises were assigned to me, and I had to dig up my review exercises from things that still hadn't been suggested by the system. I did those that I think would have come up soon, but, as i said, today nothing came up. I hope it's not their answer to my questions "how do you assign review exercises?" and "will they keep coming forever?" (which is what it looks like right now). I really want the exercises, but I also want to know how they're assigned and if it makes sense. Especially if I am asked again things that I have already mastered. Anyway, who would have ever thought that one day I'd be worried about not being assigned math homework?

Having said this, too many exercises encourage memorization, so they shouldn't give me so much review that I don't find the time to get down to it and really find out all the implications of cartesian geometry and equations.
 
Last edited:
more on resuming trading

Continuing from here:
http://www.trade2win.com/boards/trading-journals/140032-my-journal-3-a-17.html#post1756486

I checked the latest margins:
Snap1.jpg

I can deal with them, given that I always only need 25% of max theoretical margin (which is about 10k throughout the days and hours of the week):
Snap2.jpg

Furthermore, I've been thinking, and I decided that I'll get started with as many as 7 systems (only trading the small contracts for EUR_ID_05 and CL_ID_01), the best I have. This is what they've done in the forward-tested period (I can only use the last 7 months for a proper comparison, because some have been created in May 2011):
Snap4.jpg

The pace will be about 1 trade per day:
Snap3.jpg

I am expecting, if I am lucky and don't incur a huge drawdown immediately, about 2000 per month. If I can last through the first month or two, then it's all downhill from there.

Now I have another month to monitor them and see if I am just being delusional, as it'd be the case (a warning) if on this month they lost money. I haven't gotten to it yet, but the concepts to study in statistics and probability are such as these: what is the chance that I am choosing the best systems today and tomorrow the best systems are different ones? This would give me an eternal delusion. By rule of thumb, I know that these systems have always been among the best, and they've made money for the past few years (those that existed, which is most of the seven), but I don't know exactly to what degree this is true, and to what degree I am risking. Of course in trading nothing is ever certain, but, given that in the past I almost always overbetted, I have to find out a safer way and more reliable way of estimating my edge and risk of ruin. That's why I am studying math. But I can't wait forever either. So I am starting with this capital of 4000 at the end of this month, and then I'll underbet, from here on. And in the meanwhile I'll keep studying math. Hey, you can't say I never tried.

Angie - Rolling Stones - YouTube

[...]

From my past, the risk of losing won't derive from the systems' drawdown: that is a limited risk. To blow out that way, I'd have to incur, from the start, in a drawdown that happens once every two years:

Snap5.jpg

Right, what is that risk? I don't know yet enough probability theory. But I would say that happens once every 48 months, at the worst. Let's even say it happens once a year. What is the chance that as soon as i start I incur the big >4000 dollars drawdowns? It's more not probable, this I can say for sure. It's less than 50%. That is a reliable estimate and that is all I care about for now.

Mmh... thinking...

There, the readers had their effect. By writing out loud what I was planning to do, I realized that once every 2 years is too risky. I just need the least money I need to make, and the least risk I need to take. And I came up with the following:

Snap6.jpg

I got rid of EUR_ID_05, CL_ID_01, and NQ_ID_03. Now the risk of ruin only happens once every 4 years. Profit goes down, but I can sleep better, and I still make enough to build up capital while paying for the server:

Snap7.jpg

Now risk is less than half as much. By rule of thumb, I'd say I have a probability of less than 25% of blowing out (if I start and keep things this way), then as time goes by (if I keep the same systems with an increasing capital) they will get lower and lower.

I am satisfied. I'll monitor these four systems of my scatter plot (forward-tested trades by sharpe ratio), which are the ones I've ultimately picked:

Snap8.jpg

I've marked in green the four systems I'll trade, and circled in red those that will be added once we're beyond a capital of 10k (I'll add them gradually).

[...]

So... I wrote that "From my past, the risk of losing won't derive from the systems' drawdown...", but I was almost forgetting to tell you. Here it is. Now that I've decreased the risk of ruin to the least possible, which is the risk I need to take in order to build up capital, I can talk about the real risk, the biggest risk I run, judging from the past.

That would be the fact that, after observing the systems at work for a while, i'll feel the need for tampering, and even adding totally new trades. That would be a disaster. That's another reason I need a few systems to operate, because that decreases the risk of inaction and of me interfering. In the past I've blown my account many times and almost always due to my tampering. Had I let the systems operate, with the right money management, which back then I didn't have... but even with the wrong money management, I would have a really big capital by now.

But what triggered my tampering was 1) losses and 2) boredom. Either I engaged in revenge trading after the systems showed me a loss, and i aborted the exit, doubled up the trade or started a new trade, or, otherwise, after looking at the screen for hours and days, I would see an opportunity and try and seize it. Which was often a good one, but my problem is when it wasn't, because I can't exit with a loss, which means once I get in, sooner or later I blow out, because i absolutely cannot exit with a loss. That is why I cannot do any discretionary trading.

Now, after over a year with the investors and not placing a single discretionary trade with them (they wouldn't let me of course), I might be ready to not tamper anymore. It is totally clear to me that I cannot do any discretionary trading. If I did engage in discretionary trading again, like someone else said in another thread, it would show that I really do not want to make money with trading, for one reason or another. Or it might mean that i crave the excitement, or the self-destruction. But I believe i want to make money with trading, and that this time I will not tamper with the systems. The risk is now down to very reasonable levels. So, if I want to make it (make profit happen), then I can make it. Everything will be ready by the end of the month.

I am counting on about 1000 per month. If I win, I won't go to the restaurant nor blow the winnings in any way. By now I know how the drawdown works. I need to keep all the money won to withstand the future drawdown. With 1000 per month, I can increase capital, and even start paying for the server. Of course if the drawdown happens, I can wire some more money (the money saved from not paying for the server). I am tired. I wonder if the markets will take this into account.
 
Last edited:
Back home. Will do some math and then will focus some more on my four trading systems candidates. The khan academy review exercises came back. And now I regret missing them. But soon I may get very quick at doing them.

Chopin - Nocturne in D flat major, Op. 27-2 - YouTube

These guys with their crappy probability website manage to make it look easy and understandable, but I am on lesson six and it's getting quite useful and advanced. It could be taught to children, but this is good stuff:
Addition Rules for Probability

This tutorial is understated and low-key but very well made. They knock off the bull**** and start with a practical example, which is what probability is for. Then they teach you the rule:
...In Experiment 4, the events are non-mutually exclusive. The addition causes the king of clubs to be counted twice, so its probability must be subtracted. When two events are non-mutually exclusive, a different addition rule must be used.

Addition Rule 2: When two events, A and B, are non-mutually exclusive, the probability that A or B will occur is:
P(A or B) = P(A) + P(B) - P(A and B)
This is the way teaching should be. Not each time you write a 500 pages book and spend the first 20 pages dedicating it to your children and writing some more academic bull****. Those books have the purpose of showing off not teaching. This is teaching. This is quality. Concise, to the point, and no bull****. I shouldn't have to sift through dozens of pages to get this information. But that's the way it happens in college. This is the precious part of a book, not the 90% filled with bull**** bibliography, quoting someone else, and... **** them all, these academics.

[...]

Ok. I have managed to do Probability and all the new review exercises from Khan Academy (at least 10 today, as usual, and one on the infamous kinematic equations).

I was going to do statistics but I might end up not having time for it, nor for the in-depth study I wanted to do on my four candidate systems for trading. What happened is that my former neighbour called me and this time we went shopping and are eating at home. That way we save and I don't have excuses to not meet her by not wanting to go to a restaurant. So I forgave her for insulting me a month ago because I wouldn't treat her out to dinner anymore (now that I am saving). Right now she's cooking.

So I might resume my work, if she leaves early, today, or tomorrow at the latest.

[...]

Ok, it's a bit late, but I'll try to do some work on my four systems. I'll postpone statistics until tomorrow. At this point I know that I will not quit my study of math, so I can focus on quality and worry less about having to keep on going like a train. I did worry about it until now, because there was always a danger of quitting, given the early difficulties and insecurity and fear of math, which is mostly gone (after thousands of exercise questions answered correctly, thanks to khan academy - exercises are everything).

Ok, so, here it goes.

Back-tested relativized drawdown duration of the four systems trading together from 2002 to 2010:
relativized_dd_duration.jpg
There's about 8 long-lasting drawdowns, lasting several months and in one case over one year (but all according to today's prices, which won't likely be the case, as the interest rate futures are pretty high nowadays). But yes, I can expect in a year that there'll be a period of 3 months where I won't make any money. Also, two deep drawdowns by my standards, of 5k and 8k. If those deep drawdowns happen right at the start, I'm screwed.


Comparison of 4 systems by absolute return, sharpe ratio, trades, and more, in both forward-testing and back-testing:
summary_table.jpg
Ok, this says almost everything. They all have, both in back and forward testing: healthy sharpe ratios, number of trades, low max losses, low drawdowns, healthy everything. And it is normal that max loss and max dd increase in longer periods of testing (forward-testing is only two years, as here everything is counted and not just the last seven months). The only thing that is not healthy is the fact that today's performance, the forward-tested performance is higher than it used to be, as shown by the sharpe ratio. On the other hand, I can only pick systems that are performing the best today and have performed well in the past. I can't pick crappy systems because their past performance is better than present one.


Forward-tested equity line (last seven months because one system started trading seven months ago):
forward-tested_chart.jpg

and back-tested equity line (non-relativized this time):
back-tested_chart.jpg
Yeah, I know. It is quite irregular and it shows the long-lasting drawdowns I was talking about. Am I willing to sit for a year without any profit? The alternative is to go back to what we did before: brute-force optimization of portfolios, coming up with a beautiful equity line, and a portfolio that makes a lot of money, loses little, where the losses by one system are compensated by another system... one that only works in the past. No, thanks. Instead I am chosing systems individually, only the best of the best, and then I am seeing how well they fit together. And if I can't afford some of them, then I get rid of them, but I won't add any average system just because its wins compensate for the losses of another system, because this method only works in the past.

How do I view the year ahead with this portfolio?

With the premise that it's obviously rough guesstimates, from what we can see in this post, every 10 years, there's one year of going nowhere, so let's say I have a 10% chance of that happening.

If the drawdown happens immediately, then I'll blow out. What is the chance of that? Hard to do all the math, and impossible with my present skills. But by rule of thumb as usual, that's another 10%.

Then we have one yearly drawdown of 3 months. So, that most likely will happen with a year, but it will neither destroy my account nor my patience.

So, I'd say there's a 75% chance of seeing profit rise above 10k (and then I'll decide what to do), and a 25% chance of having a bad year or blowing the account (or both). Needless to say, this is very frustrating. The lack of capital is very frustrating. And I can't really blame myself for it, as I was born without it. But also I can blame myself, because I could have saved (among the other things, by not trading), in all these years... between 50k and 100k. But I've never been cheap/stingy, which now has become a quality to me. It's not offensive at all. That's a good money manager basically. You have to be stingy, not just in trading but in every area of your life, you have to monitor your balance, you have to spend carefully rather than blindly, as I've been doing all my life, until recently that is. It's ok even to go to a restaurant, or buy something useless, as long as you are aware of what you're doing and writing it down on an excel sheet. It's not good instead if you refuse to look at your balance because you're afraid of seeing things you won't like. It's not like by ignoring your balance the money won't disappear from it, and it's not like by looking at it you'll make the money disappear faster. It's funny and irrational but I've always felt that somehow if I didn't look at my balance, money would take care of itself. Wishful thinking and stuff like that. Like not wanting to do a magnetic resonance to not let the tumor grow (and I do that, too, but that because I don't trust doctors). As if the tumor grew faster because you look at it, and the account grew poorer because you looked at it. Anyway, some of that is gone now. I am proud to be cheap. Which is funny that i say that because when I take a cab, to save, I get off earlier or get on it later after walking for a while, but I always make sure that I give a large tip. That's right because I want to save money but never to be accused of having done something unfair. But then what happens is that I have to do something drastic, so to speak, like instead of going to the 5 times restaurant and not leaving tips like they do here in italy, I go to the restaurant 4 times and I always leave a tip. So basically you can save without resorting to being cheap. Or like the bitch I had dinner with tonight. I told her I wouldn't have dinners with her, but then I treated her to a hot chocolate and a pastry. That way I still look generous, while in reality I have now denied her about 12 dinners per year. I look generous because I am doing my best, but there's no way I will spend what I've been spending on her until now. So what I am saying is that I'd rather do less but well, than doing a lot, but being unable to afford it and doing it right. And I apply this to my job as well. Do as much as you can without getting sloppy because you're doing too much.

I can't apply this to my sleep though. I neve sleep enough. But that's not within my powers. My mind wanders freely, beyond my control. It's not up to me whether i sleep or not, or rather it's up to my subconscious, and as far as I know it's not happy and it makes me stay awake.

Regarding trading... sure, I could be less sloppy. For example, by trading even fewer systems and enabling only those that have a lower drawdown, thereby disabling ZN_ON_02, but I can't because that's the one that makes the most money, and if I disable it, it will take me years before getting out of these quicksand of undercapitalization, in other words, the server costs me 300 dollars a month, and it would erode all my monthly profits. I can't be trading to just pay for the server. Long story. I'm gonna stop here for now.

 
Last edited:
the beauty of equations

This was really a great invention, equations. I never fully realized it until I went back to school thanks to khan academy:
Age word problems | Khan Academy

Snap1.jpg

This is really the best exercise for me. First of all because it's simple, and it reinforces my confidence. Second of all, or even more important, it is useful. You can see immediately that this is something you could use. Not like sine and cosine, the unit circle, and similar crap. People should be taught this useful stuff from the start, so they get into it, and they start liking math. Instead they jam into their heads a lot of useless notions (at the moment of the teaching) and they make you hate it.

There's really no other way to solve these questions. I mean certainly not as quick, and if you don't know about it, it will make you go crazy, unless of course you re-invent equations, without knowing them.

Who invented them by the way?

Here they say it was the ancient egyptians and babylonians:
http://www.algebra.com/algebra/about/history/
The history of algebra began in ancient Egypt and Babylon, where people learned to solve linear (ax = b) and quadratic (ax2 + bx = c) equations...

But I am not really sure because I heard that they didn't have the zero and without that, you can't really do much. That's what I vaguely heard.

Here they agree as well:
http://en.wikipedia.org/wiki/Timeline_of_mathematics

Unfortunately my roommate is coming back in a few days. Damn, the mere thought is already upsetting me. He's going to want to joke around all day long. He talks about being a hard worker, and all he does is talk about it, so obviously he never works. He spends more time telling me how hard a worker he is than working. And doesn't let me work. I told him, when the other day he was telling me that what we have in common is that we are hard workers: "yeah, and in the meanwhile you keep talking...!". What better way could you find to interrupt someone from working than by saying that you're a hard worker? It's like that bitch nurse who woke me up in the night just to find out if I was sleeping. Nurses are evil. She woke me up by asking me if I was sleeping. There's got to be other ways to solve this problem without resorting to murder. Murder really has to be the last resort.
 
Last edited:
eureka

Wow, this is a good one. I woke up with this idea and I don't think it can be wrong.

Ok, so I take the whole back-tested relativized equity line, with today's prices (I downloaded them a few months ago, but they're still close).

Then I start with the capital of 4000 that I will have and I run several tests, whereby I hop on that equity line on random dates, starting on day one and ending one year before the equity line ends. Then I see how it goes, and I will know, according to the past, how likely I am to blow out or otherwise.

This is not going to be as quick to implement as it sounds, but it's clear what I have to do.

Oh, another thing: if at any time after hopping on the equity line, I fall below 2000 dollars, then that's clearly the moment I blow out. Otherwise I keep it going.

I don't know if this is called montecarlo testing, but I am going to pretend that's what it is. Or I could call it monte-cazzo testing, because it's a bit crappy, but it's the closest thing to science that I can afford right now, with my limited skills.

From:
Monte Carlo methods in finance - Wikipedia, the free encyclopedia
which took it from:
Financial Mathematics Glossary K-O
The Monte Carlo method, encompasses any technique of statistical sampling employed to approximate solutions to quantitative problems.

Ok, here's the file. I will attach it here, but then I'll do it from work, because otherwise I'd have to go late to work:
View attachment MonteCazzo_Simulation.xls

Ok, a few more things.

1. Given that there's already a bias, from the fact that we can only choose what works, and what works today is not likely to work as well in the future, almost by definition. But we can't do anything about this. However, what I will not do is include the forward-tested period, because that's even more bias, because i chose the systems to trade based on that period.

2. I will poll the whole population of data, so I am not "sampling", at least from the little statistics I studied. So this should be called anything but "MonteCazzo sampling".

3. I will use every part of the population, because even though of course you can't blow out if you started trading yesterday, this probability of not blowing out will be compensated by a lower profit, which I will also measure. If anything I'll get rid of the last period (where you can't blow out) at the end.

I've thought about this, while I was in the bathtub. I will have two columns, indicating the lowest and highest balance reached after starting at any given point. The first cell will indicate what's your lowest point if you hop on the equity line right there, on that specific date, and another cell will indicate what you will reach at your highest. But that second column might not even matter so I could remove it. Unless I want to do a ratio between the two.

Then I will say that if your lowest point is below -2000, that means you blow out, because I start with a capital of 4000 and IB doesn't let you trade unless you have at least 2000 on the account (the margin I need instead is lower than that).

[...]

Back at the office.

So here's the situation. This is close to a maximum drawdown calculation, but not the same thing, and we can say that what I have to do has not much to do with monte carlo simulation, not that I really know what it means anyway. Nonetheless there's still some element of randomness in my concept here, even though I can't define it exactly, being a math beginner.

So let's exemplify it. If this is the equity table:

+1
+3
-3
-2
+1
-2
+10

The maximum drawdown concept would say that the max drawdown is -6 on the penultimate trade, and that when the +10 trade happens, everything is reset to a drawdown of zero.

However what i need is different, as i said. Let's say those seven trades are my whole data. In reality I have 800 trades, or rather 800 equity days, because I measure by day, and some days there's more than one trade. But let's say I only have those seven days (each element is not a "trade", as I said earlier, but a "day").

So what I want to do is to see what would happen if I hopped on the portfolio equity line on day 1, 2, 3, 4, 5, 6, 7, which I will list again:

+1
+3
-3
-2
+1
-2
+10

The drawdown would only tell me that if I hop on the worst day, I go down -6. So, as I said earlier, I know how much margin I would need (if the past repeated itself) to be safe, and I've already said that I don't got the 8k I'd need (if the past repeated itself). So I know I am taking a risk, but I want to know how probable, and drawdown doesn't do it, because it just tells me the extent of the risk on the worst day, but not the frequency of that risk.

Let's list them one more time:

+1
+3
-3
-2
+1
-2
+10

If I hop on day one, the formula I have to devise on excel would have to tell me that, starting on that day, I can only go down... 1+3-3-2+1-2+10... -2. And what I used is the sum... the running total of the elements. And I get its lowest value, and that is what I need. But I want to have everything on one cell, rather than having an entire column per element, given that there's going to be hundreds of elements. I'm going to try this directly on excel.

[...]

...still working on it... this is really complex for my small brain... but i really need and can and will get to the bottom of this... furthermore today that my idiot colleague isn't here and I can still focus... this is something between the running total and the maximum drawdown with a pinch of array-entered formulas...

Ok, a chart might help:
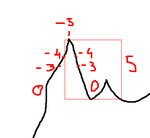
Snap1.jpg

When I have a drawdown of -5, what I am really told is that I would have lost 5 had I started trading precisely on the day at the peak of that chart. If I had started one day earlier, I would have lost 4 (by first making one and then losing it), and if I had started one day later I would have lost 4. And so on. So, among the other things, this is very reassuring, because it's telling me that the drawdown happens as it did in the past only if you happen to start on that day. So, it doesn't matter that in 10 years you've had a drawdown of 10k. (If the past repeats itself) that 10k drawdown will only happen if you start trading on the worst day of the next 10 years. Or if you keep on increasing the futures traded, which I will not do. Yes, because by ever increasing your futures traded it is as if you started trading every day.

But then of course, I don't only have to worry about starting to trade on that peak, because it's not like I have 10k and have to worry ONLY about not starting in a situation where I can lose >8000. I also have to worry about starting one day before or one day after, and so on. I have to worry about the drawdown of 7000, of 6000, of 5000, and so on.

All right. For sure it won't hurt to set up my database with the running total on a column and the drawdown on another but then also the "draw-up" and see how I can make them interact to come up with what I need.

[...]

No, wait. Maybe I don't need the "draw-up". Here's what I need:
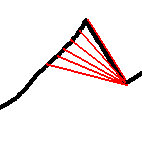
distance_from_lowest_running_total.jpg

The equity line is represented by the pivot table's "running total" function. Now I simply need the distance between the lowest level of the running total column AFTER the date I poll, and I need to subtract this value from the running total of the element polled. That way we can figure out how much we fall from each point of the equity line. So, I might be able to figure this out. This time the math I studied helped, because cartesian geometry made me understand a little better the correspondence between equations and graphs, and that sometimes something you don't grasp in an equation you can grasp from a chart.

[...]

Ok, I am getting there... Here's the columns I created and what they do:

date: the date of the day when 1 or more trades took place
daily profit: total profit (or loss) made during the day
running total: sum of previous daily profits (or losses) up to that point
lowest subsequent running total: what is the lowest subsequent point of the running total
fall between now and then: it subtracts the lowest subsquent value from the point we're at right now, and tells us what would happen to our equity if we started trading the portfolio AFTER today's trades closed (always assuming the past repeated itself).
drawdown: this is only for double-checking purposes and it makes sure that the biggest fall measure with one method corresponds to the biggest fall measure with the other method. The problem with drawdown and why I could not use it is that it is sort of a "running total of the falls", but it doesn't tell me the subsequent max fall at each spot of the equity line (cfr. charts shown above).

Probably I could have derived everything from the drawdown, but I am not smart enough to do it.

Here is the resulting chart, of the falls from the portfolio:
chart_of_falls.jpg

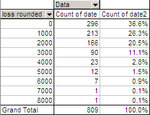
But a table with percentage is clearer in this case. This chart gives the mistaken idea that I am often above a risk of several thousands in losses, whereas, if you started trading on a random day of the back-tested period, the percentage of days where I'd blow out the account is lower than it looks on the chart.

I renamed the file from MonteCazzo_Simulation.xls to risk_of_ruin_tests.xls, which is more serious a name, for a better job:
View attachment risk_of_ruin_tests.xls

And here's the summary table:
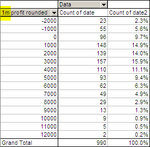
summary.jpg

So basically, if the past repeated itself, by starting on a random day, with a capital of 4000 dollars, I would have a risk of about 17% of blowing out my account, a probability of 37% of not seeing any drawdown (or less than 500, since the grouping was done by rounding to the nearest thousand). I would have two chances out of three of not seeing any relevant drawdown (less than 1500).

But this is provided that I neither change the portfolio (by let's say doubling up the contracts) nor withdraw money from the account. Because in that case, if I withdrew 1000 dollars, any loss of 1000 (depending also on when it happened) would become a loss of 2000 (1000 withdrawn from the market and 1000 withdrawn from me).

At the same time, given the knowledge that the maximum fall (both according to max drawdown and to this formula I used) is 8000 dollars, I know that if I ever reach a capital of 10k, then suddenly it becomes unlikely that my withdrawing money will cause me to blow out the account. But this short-circuiting my brain, so I can't bring it any further. There's too many things involved and I can't figure out this estimate. But I would be satisfied if the estimate I've done is correct (provided that the past repeated itself, which it doesn't and, also, it is not random).

I also tried to remove the last year, to make sure that the fact that not much time had elapsed would not decrease the probability of blowing out. It didn't make much difference. For now this is enough. I don't want to do too much and make a bunch of mistakes.

I am satisfied with this work and with the results. The third and final version is a .zip file, at the bottom of this post.
 

Attachments

  • risk_of_ruin_tests.zip
    175.9 KB · Views: 124
Last edited:
Back home.

Snap1.jpg

I was thinking about these concepts and I made a drawing. I never heard of drawup but I am inventing the concept.

More here:
Calculating peak-to-trough drawdown « hackinghat.com

I worked on defining this concept today, for the stuff i did in the previous post. As the guy explains in his post, the maximum drawdown is the largest negative (I would add) difference by subtracting one value from another value that follows it (in time). You are at 10 today and fall to 5 tomorrow, then 5-10=-5. If that's the highest, then that's your maximum drawdown. If you're at 10 today and at 11 tomorrow, it's going to equal 1, so that is not a drawdown, but a drawup. But then the duration is how long it takes that loss to be filled up. At least that's what seems logical to me. Peak-to-trough is for the depth, that you appraise only after the next peak is reached, so peak-to-peak is for the duration. The drawdown is over when you've exceeded the previous peak and have started to make money again. Otherwise there is no way to know if that's the last trough or not. So, once and for all, I think we should say something like "the drawdown lasted 3 months, and it took us as low as a temporary loss ("drawdown") of 4000 dollars".

In the same way, a "drawup" should be the largest positive difference obtained by subtracting a value from another one that follows it. So if today we're at 5 and tomorrow at 10, you have 10-5=5. But with investing probably it's not used much because first of all, anything that is not in a drawdown is in a drawup... well, no the concept escapes me right now - anyway, it should be the rule, and after starting at 0 profit, anything above it, is in a drawup. If instead you started a zero and were negative today, you would be in an uninterrupted drawdown from start (except if it went back up above zero and then came back down, in which case it'd be two separate drawdowns).

It's not that clear, at all. I am still struggling with cartesian geometry. Anyway, I enjoy explaining things, even when i don't fully understand them. Because actually i was explaining it to myself.

But actually one thing I understood. Whereas the usual concept of maximum drawdown is the loss you incur if you start trading on the worst possible day, what I wanted to find out this morning was which loss you incur if you start to trade on every single day of the equity line (and keep going until the end of your back-tested data). What I am still struggling with is why the formula was so different.

Maybe I know. Whereas the drawdown gets calculated at the peak, and so i had a function that kept its value at zero and started counting at every peak, what i did today was... I am lost. Not enough sleep, and too burned out from this past year. And work. I have to deal with that nimrod.

[...]

I am resuming today's earlier work, when I was focusing on the probability of blowing out. I will sum it all up here to resume from where i left:

Snap2.jpg

Speaking of blowing, here's a related song:

Andrews Sisters' "Boogie Woogie Bugle Boy Of Company B" - YouTube

I can't believe it. When you can sing like that, you shouldn't have to dance like a monkey. It's demeaning.

So, I was saying, the probability of blowing it is 17% according to my estimates. I can deal with that.

I'm gonna let that sit, without enriching things too much or I'll screw up some detail and come up with unreliable results.

Now I want to find out what my chances are of bringing it up to let's say 10k within six months. I'm gonna work on figuring out that one now. Yeah. I am focusing on 10k because I know I can (slightly) scale up safely, and add a couple of systems, once we reach that level (if it happens I'll run more of these tests, before scaling up).

Ok, done. Here I did have to get rid of the last six months, because you can't calculate the profit of six months if there aren't the six months ahead of the date.

This really doesn't just answer "how likely will i make at least 10k in six months?", but "where will I be in six months according to probability?":

in_six_months.jpg

The chance that I will have made at least 10k in six months is a bit more than one out of three. There's an 80% chance that I will have made some money. Yeah, 'cause we talked about drawdown all this time, but even without having any drawdown we could be sitting for a year without making any money.

But this is not good enough. There's a risk that a part of those profitable six months were preceded by blowing out my account, so I would not be there to experience the profit. So I need a filter in my pivot table, one that will exclude all those "dates of beginning of trading" that have caused me to blow out my account, because have been followed by a drawdown > 2000.

I predict that those excluded dates will be about 17%, the same figure I reported earlier. The question is which part of the new table this exclusion will affect. If I blow out my account to miss a year of going nowhere is one thing, but if I blow it to miss a year of profits, this is a big deal, because it means that if I don't blow it, i will not make any money anyway. You follow me? There might be great profit and great losses with an increase of volatility, and I might be screwed whether i blow out or not, because in both cases I'd make no money. I don't think it will be the case, but let's check.

No, wait. I was wrong in my assumptions. This only tells me which blow-out losses happen to each date I start trading, but not if the losses happen before or after the six-months. However, I checked on the chart, and it's practically always before. Because there are rarely six negative months. It's complex to explain and understand but I am positive that all or the majority of the dates have the losses before the six-month profit.

So here's the chart, that I called "what follows losses" and I thought it was a big mistake but all in all it's pretty accurate even though not guaranteed (that losses happen before the end of the six months, since in theory it could go up for six months and drop later, but it probably never happens):

what_follows_losses.jpg

Given that losses happen BEFORE the end of the six months (I know from checking the chart), I will be in the situation where if I blow out I will miss out on profitable six-month periods, and if I don't blow out I might not. I will have to see how this affects my probability.

For example, I cannot expect to make the 11000 made by starting on the date that also causes me a drawdown of 8000, because that drawdown of 8000 will cause me to blow out my account.

All in all, there are 757 dates being analyzed, with 757 different outcomes, some of which cause me to blow out my account, so I will exclude those and see how profitable are the six months of those dates that don't cause me to blow out, and if it's random or not.

So, I did get rid of the 127 blowing out dates, which is precisely the 17% i expected, so until here it's all good.

Oh, good. Now the probability, of making at least 10k in the first six months, has risen to 41%, from 36% (on the sample that included all dates, including those that would cause me to blow out). So this means that, if I don't blow out by incurring in that 17% probability, then my chances of making those 10k are even higher.

So I can now sum it all up like this: I have a 17% of blowing out, and, if that doesn't happen, I have a probability of 41% of making 10k in the following months, and of 90% of making at least some money. But all this only if I do not incur in the 17% chances of blowing out my account.

Now the next question would be: if I blow out how quickly will I blow out? When can I now if I have escaped the danger?

drawdown-duration.jpg

The "fall" part of the drawdown is at its longest (cfr. chart above) 5 months.

Therefore I'll phrase it again: I have a 17% of blowing out, and, if that doesn't happen within the first 5 months, I have a probability of 41% of making 10k in the first six months, and of 90% of making at least some money. Of course the past doesn't repeat itself and things always go worse, but, given that this time I did not overoptimize things, the underperformance will not be 50% as we saw last year, but probably only 33%. But for sure there's an underperformance, for the same reason why you can't pick the winning soccer team of this year and expect it to win again year after year. Yes, it will be more likely to win, but not certain. In the same way, these excellent systems are likely to do well, but not as well. I chose them because they did the best, and not because i appraised them as those who'd be the best. Therefore I cannot be right. If I had instead chosen them because they were promising based on some other reason and then I had gotten it right, then my prediction might be more reliable. But instead I am just betting on the winners, which, as far as my abilities go, the most reliable way to choose systems.
And now I have to wait a few weeks before I start. In the meanwhile I'll post weekly updates on how these four systems are doing. I've chosen them, so there's little risk of cheating myself. I identified them months ago, and here's what they've been doing in the past few months:

money_made_since_monitoring.jpg

Hmm. Actually, now that I looked at it. I've been monitoring them only for 2 months, and they've made only 350 dollars during this period. This could be a trick of wishful thinking and the ones making money might be forever changing and I might forever select the wrong ones. To some degree it is certainly true, but these systems have worked for years of forward-testing, so I am not too worried. They should make money. Maybe not as quickly as in the last year.

The Quarrymen - I'll Follow The Sun [Original / Early Beatles] - YouTube

I'll Follow the Sun - Wikipedia, the free encyclopedia
"I'll Follow the Sun" is a song by The Beatles. It is a melancholy ballad written and sung by Paul McCartney and credited to Lennon–McCartney.[1] It was released in 1964 on the Beatles for Sale album in the United Kingdom and on Beatles '65 in the United States, but was written long before that year: a version recorded in 1960 can be found in the bootleg record You Might As Well Call Us The Quarrymen.
 
Last edited:
Major breakthroughs thanks to the statistics and probability work I've done and posted here in the last 24 hours. It turns out that yes the drawdown slightly increases by adding those contracts I had discarded, but the max drawdown concept is a deceiving one. That max drawdown day actually indicates what happens if you start trading that one day during the course of ten years.

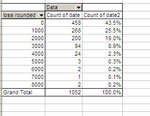
On all the other instances things instead get better, by adding systems, and the likelihood of blowing out goes from 17% to 12%. The likelihood of making 6000 in the first 6 months goes from 36% to 56%. I'm going to keep investigating but so far it's all clear. A slight increase in max drawdown is accompanied by a sharpe decrease in overall drawdown (the drawdown calculated by hypothesizing a start of trading on every day of the back-tested data), and accompanied, obviously, by a great increase of the rate of profit, which means getting away from the blowing out danger much more quickly.

Why profit increases is obvious: more systems. Why overall drawdown decreases may be due to diversification and therefore, once again, from more profit which is coming from different sources and at different moments, which prevents each system from reaching its max drawdown (because the others are making money in the meanwhile).

Somehow the rule I've always noticed is confirmed: the max drawdown increases as you increase systems, but the overall drawdown decreases. For example, you look at max drawdown and see an increase from 8k to 9k, but if you look at the smaller drawdowns all around it, instead of having five -4000 periods, you only have... or rather the absolute amount of drawdown days might even increase, but in proportion they get moved from big drawdowns to small drawdowns. No wait: actually they decrease not just in proportion by a lot but also by absolute count.

Look at this comparison:
Snap1.jpg

At the cost of risking 1k more in one trade, you get rid of 12 potential blow-out starting dates.

And this is just the benefit in drawdown. Not to mention the benefits in terms of profit. It takes half as much time to get away from the dangerous area of blowing out. The only limit is the fact that if you push it too far, you can't trade all the systems at once, and if you start skipping trades, things might change. You might be there to take a losing trade, but you might miss the next winning trade. On the other hand, I can't say that a random distribution of trades between the available systems would hurt the equity line. It might be neutral.

This risk of ruin table I did today is much superior to any previous drawdown estimate i've done.

Ok, so now I have a 12% probability of blowing out:
Snap3.jpg


And if that doesn't happen, I have a 57% of chance of getting to 10k (by making 6000) within the first 6 months:
Snap2.jpg


And these are the 6 systems that I'll be monitoring throughout this month and will start trading at the end of this month (EUR and CL with their small half contract):
asdf.jpg
Everything looks coherent (back vs forward testing) and healthy. They're all different. The rationale for the systems is totally different for almost each one of them.

I am expecting a profit of at least 1000 per month, according to the past few months of forward-testing:
Snap4.jpg

And here's what this looks like on a chart:
Snap6.jpg

I am a little scared, because there's always a 12% chance, if not more (up to 25% I'd say), of rapidly blowing out the account (which means losing 2000 dollars). But it's my work, I believe in it, and, if I don't get compulsive and add trades of my own, this is more likely to work than to fail.

By the way, I can't believe my dad for a whole year kept telling to take his money, while I was busy trading with other people, and as soon as I've stopped, he stopped offering his money. He's like the banks: "A Banker Lends You His Umbrella When It’s Sunny and Wants It Back When It Rains". That's my father: he's always offering help when it's not needed, and offering advice when it's too late for it to be useful. Mother ****er.
 
Last edited:
Twelve hours of work and I still can't sleep. Damn. Days go on and on. They don't end.

Loneliness has followed me my whole life, everywhere. In bars, in cars, sidewalks, stores, everywhere. There's no escape. I'm God's lonely man.

I'm gonna do some more math. Probability has proven really useful, even the little bit I read. It's starting to give me a different attitude on life and trading, a rational one, which is effective for trading.

Each night when I return the cab to the garage, I have to clean the cum off the back seat. Some nights, I clean off the blood.

Taxi Driver (1976) - Memorable quotes
 
Last edited:
Here's my situation at khan academy:

Snap1.jpg

There was a software problem a couple of days ago and it shows that i did 6 hours of math in one day, which is not the case. Then, another problem has it that I did two new exercises, which I didn't, since I've been done for over a week. Other than that, I've been doing review exercises (even as I write), and my stars and balls are disappearing into the past, because there's only month of history. I've already complained about it, but they didn't fix it. And so we beat off, boats against the current, borne back ceaselessly into the past.

I've done probability today. This one, which was beautifully explained as usual:
Independent Events

I didn't do statistics. I'll do it now:
AP Statistics Tutorial: Dotplots

The more I do, the more I see how different they are. Prob tells you what could happen and according to what rules. Stats tells what has happened, and it's up to you to find out what rules could have caused it. Prob is much simpler, so far. Prob is neat, and stats is a mess, a mess of data. And not just because the website is for children. It's got little jargon, few rules, and offers me a lot of reasoning. Statistics instead is jamming into my head a lot of jargon, some rules to memorize, and it's offering little reasoning. Yet both courses are good.

For example, today I was interpreting statistics to infer probability about the future. It's called inferential statistics I think, and I guess it could all be within the branch of statistics:
Statistical inference - Wikipedia, the free encyclopedia
In statistics, statistical inference is the process of drawing conclusions from data that are subject to random variation, for example, observational errors or sampling variation.[1] More substantially, the terms statistical inference, statistical induction and inferential statistics are used to describe systems of procedures that can be used to draw conclusions from datasets arising from systems affected by random variation.[2] Initial requirements of such a system of procedures for inference and induction are that the system should produce reasonable answers when applied to well-defined situations and that it should be general enough to be applied across a range of situations.
In some way we could say that statistics seems to be self-sufficient in doing everything. And maybe viceversa, too. They're two different fields that overlap 33%. From the little I've seen so far.
 
Last edited:
Ok, hold on... the "major breakthrough" was only partial, and basically, as it was yesterday, I had it wrong without realizing it:
http://www.trade2win.com/boards/trading-journals/140032-my-journal-3-a-19.html#post1760076

The problem was in using those percentages I used:
127130d1325802588-my-journal-3-snap1.jpg


In fact yesterday I got lucky and that addition of one system improved the absolute number of starting dates that would cause me to blow out my account, going from 134 to 122. So I could indeed say that by adding one system and even increasing the absolute drawdown you might actually reduce your chance of blowing out your account. But today i was about to make a mistake which I probably made yesterday with previous portfolios comparisons (not with this example below):

Snap1.jpg

If you compare the days in eight years that would have "blown out" a 4000 account (simply by bringing it below 2000, which is IB's minimum to trade), it's clear that the new combination on the left is worse than the previous combination on the right: 152 vs 126.

However, if, as I did yesterday, you compare percentages, you will get deceived into thinking they're the same, in that there's almost an equal percentage of dates on which you'd risk blowing out your account (if you started, randomly on those dates).

But these percentages are totally useless here, because they're just telling us how many starting days, out of those causing a drawdown, would be lethal. But we want to know how many days out of all starting days would be lethal. So I have to do it all over again now. And either create a percentage for that ratio, or get rid of this percentage column altogether...

[...]

No no, wait. I did well to worry but i was wrong now and right yesterday. In fact, since the "0" row is there on those tables, also the days with no drawdown are counted, and therefore all the trading days appear (days in which there are no trades are not counted: that is why with more systems there's more days). And so the percentage values are correct and provide important information.

[...]

But then I just checked and it's an interesting finding. If I trade the best ("best" considering my needs: profit, low drawdown, low margin) system all alone, I am more likely to blow out (19%) than if I trade my best seven systems together (13%). Furthermore, if I trade them I have a probability of 88% of having made at least 6000 dollars within the next six months, whereas if I trade the best one all alone, I only have a 17% chance of making it happen. Considering that time is money, and that I have to pay 300 dollars each month for the server, then it's clear that the best choice is to invest in a bunch of systems.

I think this can be explained with the fact that by trading a lot of systems I am not actually summing up all the drawdowns, because the trades are taken in a sequence (one system, then the other), and therefore I add diversification and at the same time I distance myself faster from the low initial capital. So it is still a surprise, but after all these tests, it seems that, paradoxically, investing in a bunch of volatile systems with big drawdowns is safer than investing in one system with a small drawdown.

Yeah, I get it. The systems don't have the time to reach their full potential in terms of risk. There's one trade by one of them, then there's another trade by another one. It's not like trading them all at once means adding up all the maximum drawdowns. In theory it does: but that is one day in one hundred years, and before it happens you'll have so much capital that you'll be ready for it to happen. The big premise is that I am not saying you're safe with a capital of 4000 to trade all these systems. I am saying you're safe to start with it, without withdrawing anything afterwards. Otherwise of course you won't be ready for the drawdown which sooner or later will happen.

Ok, so I am going to adopt this new combination with 7 systems in it, and expecting (judging from the past) a 13% chance of blowing out, expecting to not have enough margin to trade them all on some rare days, and expecting, if I don't blow out within the first six months, to have an 88% chance of having made more than 6000 dollars, and therefore be farther from the risk of blowing out.
 
Last edited:
weekly update

HTML:
system    $ per contract potentially traded
CL_ID_01    -393
ZN_ID_06    -66
NG_ID_02    104
ZN_ID_03    -269
ZN_ID_03    28
GBL_ID_02    234

Ok. Good, not having started yet, I have missed an unprofitable week. This is the combination with the seven selected systems (cfr. previous posts).

This is how the last few weeks look for the present portfolio of systems:
Snap1.jpg

If it keeps going like this, it will alert me as to the risks of portfolio optimization, because this is my final portfolio.

Oh, look! By randomly reporting the last few weeks, I have an example of a potential blowing out situation. In the attached picture above, modified here below, with red mark, there's a clear example of what I mean with my statistic:

Snap3.jpg

If I had started right before the 47th week of the year, I would have blown out my account (by losing more than 2000, I would not have had the 2000 necessary to keep trading). You look at that, and you say: hey, this danger is very close... I need to be prepared for a 3000 dollars loss or I won't survive. But the truth is that if you had started 10 days earlier or exactly one week later, you would not have blown out the account. Only if you had started on that one day of the year you would have incurred the 3000 dollars loss, so the chance is minimal, 1 out of 240. Ultimately, the probability is always the same, 13% of blowing out the account, by starting to trade on any given date. This happens because I am not planning to withdraw money in the first few months, because if instead I constantly kept withdrawing all the profits, and leaving 4000 dollars on the account, then yes, absolutely: I would blow out the account within the first year.

Since the portfolio is final or at least getting closer and closer to it, let's do one more statistic and see the money you can make in 1 month, starting on any given date of the back-tested period (relativized data by today's prices):

Snap2.jpg

All outcomes surround 4000. As I have learned today, this looks like a bar chart (because there's space between the columns), but is a histogram:

Snap5.jpg

Yeah, because here's what it says:
AP Statistics Tutorial: Bar Charts and Histograms
Here is the main difference between bar charts and histograms. With bar charts, each column represents a group defined by a categorical variable; and with histograms, each column represents a group defined by a quantitative variable.

Anyway, after one month, if I still haven't blown out the account (13% probability, if the past repeated itself, but I know that it is likely to be somewhat worse), I am most likely to have made several thousands dollars.

[...]

Since I keep talking about "relativized" back-tested data, what I mean by that is:

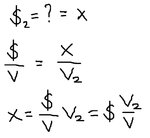
1) given that we expect prices (and thus profit/loss) today to move as much as they moved yesterday, so they'll go from 100 to 102 as fast as they went from 50 to 51,
2) I have adjusted yesterday's profit/loss according to today's prices, by multiplying all trades' profits/losses to the ratio of price of yesterday over price of today.

Like this:
relativization.jpg

Profit of yesterday is to yesterday's price (value of underlying, which is the same as the value of the future) what the unknown new price is to the price of today. And then we obtain the new adjusted profit/loss by multiplying the old one by the ratio of price today / price yesterday (and by price once again I mean the price of the future/underlying). That way we know that if we get a drawdown of 10% of the underlying when price was half of what it is today, we'll come up with an adjusted drawdown for then. Otherwise all drawdowns when the price was lower than today will appear smaller by today's standards. The only small question would be: are we sure that when, say, CL is at 120, it is as likely to fall/rise as when it is at 50? But there's no way, with my limited tools, to measure this across all futures, so I am assuming yes (more or less).
 
Last edited:
Done daily math review at khan.

Doing the course on probability, which turned out to be more interesting than the statistics one, at least so far. From what I've covered so far, on these two subjects/courses/websites, probability is more about reasoning and statistics is more about memorizing notions. Not totally like this, but for the most part.

With probability, things have been interesting, as I said, and at the same time easy until today, because I had read something on probability before, because the material is not too much, but also because she is very good at simplifying things. Maybe I would have known the answers without reading the material, but she's good at showing you the right way to approach problems and, only later, you are given a formula. You feel like you came up with the formula, almost, which is the way it should be. Unlike in my awful education, where I was force-fed notions, everything on this website starts from a simple probability problem/example, which gets solved, and then you are shown there's a general rule, and the formula is stated and explained, like here:
Conditional Probability
Summary: The conditional probability of an event B in relationship to an event A is the probability that event B occurs given that event A has already occurred. The notation for conditional probability is P(B|A), read as the probability of B given A. The formula for conditional probability is:
conditional_formula2.gif

The Venn Diagram below illustrates P(A), P(B), and P(A and B):
conditional_venn.gif
I remember a couple of idiots writing posts on "my journal 2" and berating me because, given that I was doing highschool math, according to them, I never would have been able to achieve anything with my trading systems ("you're up against the quants" or something like that). First of all, I can study what I want and write what I want on my journal, and obviously I shouldn't have to deal with such disrespectful posts (I don't see the point/contribution of a series of posts telling me "I think that you'll never make it"). Second of all, I don't want to be bothered by their stupid thoughts, so that is why I started a new journal with the setting "only posts from contacts", and it's working great. And finally, I don't care that this website is primarily meant for teenagers or even children. It's very well made, and its content is very useful. Besides, children are more intelligent than adults. Or rather, adults teaching children are smarter and much better teachers than adults teaching adults, because the academics are not trying to teach anything to begin with. They are just writing books to show off and to impress other academics. Whereas the unknown highschool teachers are really trying to teach something. Unlike the academics, the highschool teachers, when they're good, make an effort to explain things as clearly and logically and concisely as possible.

Now, I'd like some good highschool teacher to teach me portfolio theory, and instead I am stuck with this academic crap: http://www.math.ust.hk/~maykwok/courses/ma362/07F/markowitz_JF.pdf.
 
Last edited:
Top