Ok, fellas. What awaits me this morning, it's a Saturday, is working on my systems' money management. I need to find out if the average absolute deviation is better or at least as good as the standard deviation (stdev() and stdevp() on excel), in which case I will swap them, because it is far simpler and it doesn't make sense to make things more complex. As you know, or at least I know, because I said it before here, the average absolute deviation (avedev() on excel) is exactly what it says: the average of the absolute deviations from the mean. On the other hand, the lower form of intelligence known as "standard deviation" is just a fashionable excrement, which no one really remembers what it is - they just use it. People are strange.
THE DOORS - People are strange (1967).MPG - YouTube
Cfr. this excellent paper on the difference between standard deviation and average absolute deviation:
Revisiting a 90-year-old debate: the advantages of the mean deviation
Cfr. these previous posts I wrote about it:
http://www.trade2win.com/boards/trading-journals/140032-my-journal-3-post1788334.html
http://www.trade2win.com/boards/trading-journals/140032-my-journal-3-post1809600.html
The little huge problem I have always had with it is that they compute all differences, do not remove the sign (making them "absolute deviations") which would have been the easiest thing to do, then they sum them and divide them by their number, sometimes even minus one, which corrupts the result even further, and then they square root them!
Dude, this is not the simplest and most effective way to do this, so I am all against it. If I have -2 and then do the square, which is 4, and then do the square root, I get 2, which is the absolute value. And so far so good. But if I compute the mean of all squared deviations and only then do i take the square root, then things are different and corrupted, so corrupted, that we cannot say anymore, as many say, that the standard deviation is the average deviation. It is not. It is some garbage. It is not the average deviation, for sure.
Once I've done this, and have automated my fixed fractional approach, by creating a totally self-sufficient formula, which still needs many tests, then I'll focus on automating the selection of the systems that pass the test of the fixed fractional. This second part actually comes first.
In other words, I first select the best systems. And then I apply to them a fixed fractional approach of allowing them to risk 2% of my account on each trade.
...
Let us do the tests of avedev() vs stdev() and stdevp() with my trades from three systems: AUD_ID_01, AUD_ID_02, AUD_ID_03:
AUD_ID_01
-35.70
-95.70
-165.70
194.30
524.30
-75.70
264.30
-115.70
304.30
64.30
-85.70
274.30
AUD_ID_02
334.30
644.30
474.30
-205.70
274.30
-645.70
-385.70
44.30
-55.70
-225.70
-465.70
-245.70
-45.70
324.30
-205.70
-115.70
-345.70
264.30
274.30
1,244.30
-375.70
274.30
-1,275.70
414.30
-135.70
404.30
134.30
334.30
184.30
324.30
-675.70
-175.70
-175.70
-275.70
-445.70
184.30
-95.70
-5.70
234.30
-295.70
1,084.30
274.30
624.30
-615.70
934.30
-1,235.70
-775.70
114.30
674.30
-325.70
114.30
14.30
144.30
-365.70
-565.70
-65.70
-405.70
-35.70
244.30
204.30
494.30
-405.70
114.30
544.30
84.30
-445.70
-85.70
-25.70
4.30
264.30
404.30
-505.70
84.30
184.30
-25.70
84.30
64.30
-5.70
-65.70
104.30
-515.70
274.30
104.30
-95.70
374.30
394.30
AUD_ID_03
-635.70
-505.70
4.30
494.30
-225.70
244.30
-215.70
514.30
-85.70
354.30
-45.70
244.30
-255.70
-435.70
-125.70
424.30
114.30
34.30
14.30
114.30
54.30
-455.70
-505.70
-405.70
-205.70
14.30
14.30
-15.70
134.30
214.30
-185.70
124.30
-75.70
94.30
34.30
84.30
-175.70
Here's the results:
AUD_ID_01
stdev 219
stdevp 209
avedev 187
...
stdevp/stdev 96%
avedev/stdev 86%
AUD_ID_02
stdev 429
stdevp 427
avedev 323
...
stdevp/stdev 99% (much larger sample of trades, that's why)
avedev/stdev 75%
AUD_ID_03
stdev 279
stdevp 275
avedev 217
...
stdevp/stdev 99% (much larger sample of trades)
avedev/stdev 78%
Ok, so obviously we can just focus on stdevp vs avedev, given that the other one, stdev, only differs when there's very few trades, which is never the case with my samples.
Their ratio is pretty much constant, and probably taking the square root after averaging the squared deviations is something that increases the weight of the outliers, as suggested by my math tutor (we spend an hour discussing the difference between average absolute deviation and standard deviation, and he's an engineer but he had never noticed this issue, and I almost got him to agree with me).
Even our old foe, the sharpe ratio, would be so much friendlier, if we reduced it to simply: average profit divided by average absolute deviation. But hell no, they had to add a whole bunch of things to make it complicated, unnecessarily. They use standard deviation to begin with. And they add the risk-free rate, which again is useless for traders. Because we don't go after making 5% a year, but at least 100% a year, so the risk-free rate is so tiny that it is just a nuisance and doesn't add anything useful.
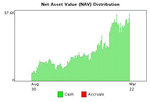
Let's take a little break and show off my latest equity curve. It's the highest it's ever been. Let's enjoy it while it lasts:

What really gives you a sense of the achievement (or the luck) is not just the slope (which can't get better, because the scale would simply keep getting smaller: it can't go through the roof), but also how small the initial column is getting. We're almost to the point of it being one tenth of the last column.
But this chart is mostly the fruit of my discretionary trading (only about one third of all profit came from automated trading), and I won't be satisfied until I automate the money management of my trading systems and I get a monthly profit from my systems.
Why, because I am very aware that my discretionary is... ultimately... not profitable. My discretionary trading will blow out my account, because I am not capable of taking losses. Sometime something will go wrong enough to upset me. I will lose my emotional balance enough to ruin my financial balance.
Each time i get high on my equity curve, I must remind myself of my previous equity curves:


They just didn't keep rising to a million. I ended up doing something wrong, repeatedly. Not just me but the investors as well (even when every was automated, except for our selection of systems/contracts). It just happens and it happens quite soon, unless:
1) you have an entirely automated approach
2) you have a statistically sound money management, and it's automated
I have neither right now. I am trading discretionary. And I am picking my systems/contracts by guesstimates.
So... let's get back to work.
The first thing I'll calculate on excel is the correl() between the stdevp and avedev of my 120 systems. If it'll be above 0.95, then I'll go ahead and even change the sharpe ratio formula to one using just average trade over average absolute deviation, and simplify it once and for all.
... that's it! It gives me 0.986759804
Awesome.
This means all the garbage they put in the standard deviation is useless. How do you get rid of the sign? Morons square the deviations, average them and then take the square root of them. Me, I just take the sign away from it and I am done. And I don't corrupt the formula.
From now on I am officially through with standard deviation. It is out of my mind for good.
From now on I will use average absolute deviation instead.
I will now change the workbooks where I am using sharpe ratio to a sharpe ratio that uses avedev.
...
Done.
What's next?
Bath tub, with 2 phones, so I can write down any eureka intuitions that come to me.
...
Back from the bath tub and... bingo!
Fascinating simplicity.
Here's my plan.
I have two phases:
1) selection of good systems
2) fixed fractional to allocate contracts for the good systems (with varying amounts of capital)
Things to do, according to phases:
1)
A. find out how good the (new) sharpe ratio is, and if it includes the info given by profit factor: check correlation and if there can be a system with good sharpe ratio and bad profit factor and viceversa. If there isn't, then we can skip profit factor altogether.
B. define certain fixed rules for the selection of systems such as for example: need more than 20 forward-tested trades, need more than 1000 dollars in yearly profit (no point in trading miniature systems... or wait: yes point, because you can use many contracts!), etcetera.
2) see if fixed fractional with a simple division of capital available by average absolute deviation works, as I expect.
And then I am done. Years of work to come to simple formulas like the above.
(new) sharpe ratio vs profit factor:
2% 1.0
2% 1.0
2% 1.0
3% 1.1
3% 1.1
4% 1.1
4% 1.1
4% 1.1
4% 1.1
6% 1.1
7% 1.2
8% 1.2
8% 1.2
8% 1.2
9% 1.2
9% 1.2
9% 1.2
9% 1.2
10% 1.2
11% 1.2
11% 1.3
12% 1.3
12% 1.3
12% 1.3
12% 1.3
12% 1.3
13% 1.3
15% 1.3
16% 1.4
16% 1.4
16% 1.4
17% 1.4
18% 1.4
18% 1.4
19% 1.4
21% 1.5
22% 1.6
22% 1.6
22% 1.6
22% 1.6
23% 1.6
23% 1.7
25% 1.6
25% 1.7
26% 1.7
26% 1.7
26% 1.7
27% 1.8
27% 1.7
27% 1.7
27% 1.7
31% 1.8
31% 1.9
33% 2.0
34% 1.9
35% 2.1
37% 2.0
38% 2.2
38% 2.2
41% 2.3
42% 2.3
43% 2.4
47% 2.8
47% 2.4
Obviously, given the simplification of the sharpe ratio (now for me it is just average profit over average absolute deviation), I measure it in % terms. I came up with just the systems that are profitable.
Let's now compute the correlation, which will most likely be above 0.9.
... and Bingo!
0.982929928
We can totally rule out profit factor, because sharpe ratio totally takes care of it.
...
Another interesting thing I remarked is that sharpe ratio even works for systems that did not have any losses yet:
JPY_ON_02 has had 2 trades, both wins:
1,019.30
156.80
This gives it a (new) sharpe ratio of 1.36, because the average profit is higher than the average absolute deviation.
Let's move on to the next step.
Things to do, according to phases:
1)
A. find out how good the (new) sharpe ratio is, and if it includes the info given by profit factor: check correlation and if there can be a system with good sharpe ratio and bad profit factor and viceversa. If there isn't, then we can skip profit factor altogether.
B. define certain fixed rules for the selection of systems such as for example: need more than 20 forward-tested trades, need more than 1000 dollars in yearly profit (no point in trading miniature systems... or wait: yes point, because you can use many contracts!), etcetera.
2) see if fixed fractional with a simple division of capital available by average absolute deviation works, as I expect.
Ok, after I'll be done I'll go buy some Japanese sushi and beer to celebrate (not the restaurant though).
Let's define the fixed rules that will allow me to discard systems, other than those discarded via the (new) sharpe ratio.
Ok, the limit is set at >= 10 forward-tested trades.
...
Done. I had to do a lot of customizations for part #2, because a lot of my ES/YM/NQ systems are identical, and, given how correlated the traded futures are, the systems produce very similar trades, so I had to divide their contracts by 2 and 3 in most cases, to avoid giving too much weight to very similar trades.
Now I'll see, in the coming weeks, if this automated (yes, it is entirely automated now!) methodology works correctly in every aspect.
...
In the meanwhile the two popes have met and are hugging:

...
At any rate, this is just excellent. These are the weeks it would have produced if used from the start of my seven months:
1,147
3,153
13,980
3,347
-766
5,009
702
-4,866
-9
-3,561
2,031
3,371
332
5,548
-5,152
-2,214
337
1,677
950
2,993
3,523
1,037
-2,257
2,749
-145
4,144
409
5,014
5,342
225
-2,255
Worst drawdown just about 8000 dollars lost, twice. In the past 7 months, and this is all automated.
The return is about 6000 per month, which, on the capital of 45k which I've been using in my test, is equivalent to 13.33%.
This is good.
If instead we use the whole forward-tested sample, the weekly gain goes from 1500 to 3000, which is good, because the difference when i picked the systems by eye used to be much bigger like one to four, rather than one to two.
This could be good, real good.
Look at the equity curve, with this automated money management:

Also, in the whole forward-tested sample, the overall drawdowns do not exceed the 8k that are incurred in my brief 7 months.
Given that as capital will increase, so will the contracts allocated, I have to fear a loss of about 20% (8k out of 45k) in the worst months, about 3 times per year, and expect an average profit of 13% every month (6k out of 45k invested).
I could even slow down a little in the future, and accept a 10% return while limiting drawdowns to about 15%.
Provided that I do reach 45k next week, then I am all set. A life of peace, away from people is awaiting me.
I wish to hear nothing but this:
Satie: Gnossienne No. 5 - YouTube


