You are using an out of date browser. It may not display this or other websites correctly.
You should upgrade or use an alternative browser.
You should upgrade or use an alternative browser.
- Status
- Not open for further replies.
Yamato
Legendary member
- Messages
- 9,840
- Likes
- 246
latest crappy pivot point system
It did it for the fourth time in a row. Built a beautiful system on 3 rollercoaster months, then tested it on the out-sample and it just lost money, not a lot, but just lost money. And yet it is very simple, precise and logical.
Pretty disappointing, but I am glad that the out-sample is sparing me illusions.
I can share it because it is crappy, so if anyone has advice let me know. Of course, as soon as it will be perfect, I will not put it on the journal:
Code:
Inputs: test(0), test2(0), test3(0);
variables: Pivot(0), R1(0), S1(0), nearness(0), trailing(0), ma_entry_value(0), ma_exit_value(0),stoploss_value(0);

Pivot = (HighD(1) + LowD(1) + CloseD(1))/3;
R1 = 2 * Pivot - LowD(1);
S1 = 2 * Pivot - HighD(1);

nearness = 0.0015;
ma_entry_value = 14;

trailing = 0.0044;
ma_exit_value = 4;

stoploss_value = 0.0050;


If marketposition = 0 and date>=1100505 and entrydate(1) <> date then begin

If lowd(0) < Pivot + nearness and lowd(0) > Pivot - nearness
and lowd(0) < AverageFC(c, ma_entry_value)
Then buy("Long") this Bar;

If highd(0) > Pivot - nearness and highd(0) < Pivot + nearness
and highd(0) > AverageFC(c, ma_entry_value)
Then sell("Short") this Bar;

end;


If c > r1 - trailing and c < AverageFC(c, ma_exit_value) then exitlong ("L trailing exit") this bar;
If c < s1 + trailing and c > AverageFC(c, ma_exit_value) then exitshort ("S trailing exit") this bar;

If openpositionprofit < -stoploss_value then exitlong ("L stoploss") this bar;
If openpositionprofit < -stoploss_value then exitshort ("S stoploss") this bar;Yamato
Legendary member
- Messages
- 9,840
- Likes
- 246
changing visual effects on windows 7 and more philosophizing
Among all the crappy changes, there's been fade menus and other wastes of performance on windows 7.
While I wait for my data, from either adamus or disktrading.com, neither is replying, I was making some changes on the windows 7 system of the server.
Well, guess what. First of all: this is the best link, right here:
http://www.sevenforums.com/tutorials/1908-visual-effects-settings-change.html
However, if you make the changes and then click "ok", you're ****ed, because it goes right back to the default w7 theme. So, guess this mother ****er: to keep your changes without losing other changes you made (the windows classic theme), you first have to click "apply", before clicking "ok". It really sucks.
But guess what. After a lot of work, I got it to look reasonably simple and efficient, more or less like windows 98. Yeah, in many ways that was the best windows system, because after that they began with the bull****, such as the rounded corners of windows xp. That is a warning sign of the empire beginning to fall, when it starts rounding the corners and using up space in order to make things look nice instead of making them work properly.

But check out this forum in general: a forum with 10 thousand online active viewers at any moment. This is really something:
http://www.sevenforums.com/
This forum alone is more useful than all the microsoft sites put together.
Among all the crappy changes, there's been fade menus and other wastes of performance on windows 7.
While I wait for my data, from either adamus or disktrading.com, neither is replying, I was making some changes on the windows 7 system of the server.
Well, guess what. First of all: this is the best link, right here:
http://www.sevenforums.com/tutorials/1908-visual-effects-settings-change.html
However, if you make the changes and then click "ok", you're ****ed, because it goes right back to the default w7 theme. So, guess this mother ****er: to keep your changes without losing other changes you made (the windows classic theme), you first have to click "apply", before clicking "ok". It really sucks.
But guess what. After a lot of work, I got it to look reasonably simple and efficient, more or less like windows 98. Yeah, in many ways that was the best windows system, because after that they began with the bull****, such as the rounded corners of windows xp. That is a warning sign of the empire beginning to fall, when it starts rounding the corners and using up space in order to make things look nice instead of making them work properly.

But check out this forum in general: a forum with 10 thousand online active viewers at any moment. This is really something:
http://www.sevenforums.com/
This forum alone is more useful than all the microsoft sites put together.
Last edited:
Yamato
Legendary member
- Messages
- 9,840
- Likes
- 246
Windows 7 Time Synchronization
Wow, I just solved yet another very important issue for an automated systems server:
http://www.sevenforums.com/general-discussion/93325-windows-7-time-synchronization.html#post808058
Another awesome link:
http://tf.nist.gov/tf-cgi/servers.cgi
Funny how the otherwise very useful post is listing exactly the one server that is no good out of all the good ones:

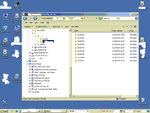
For some strange reason, unlike what everyone says on the web, my xp setting time interval place is here:

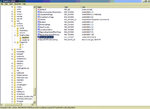
I changed it from a week (604800 seconds) to an hour (3600 seconds) and now it works perfectly.
Now let's go to see where it is on windows 7.
Damn. It turns out that:
http://stackoverflow.com/questions/...t-differ-from-controlset001-and-controlset002
So that guy up there was right and many others on the web were wrong. However he might have been wrong about the rest.
Now let's do it.
Yeah, he's wrong about "config". I have to go to "time providers" here as well. Damn moron.
Anyway, on w7 is the same exact thing as on xp:

There is one difference, in that it will not tell you when it has updated time, because in w7 actually they got rid of some information provided by xp, in line their making the subsequent product worse than the previous. Probably because for xp one guy was in charge and for w7 another guy was in charge. An idiot.
Wow, I just solved yet another very important issue for an automated systems server:
http://www.sevenforums.com/general-discussion/93325-windows-7-time-synchronization.html#post808058
One way around your problem is to do a Direct Sync. with a more reliable Time Server than the ones Windows uses.
The US Atomic Clock IP Address is 132.163.4.102 ,Type this Address in your Internet Time Servers Slot and press the update now button. Windows will keep this address as its default sync. address until you change it. The sync. is always flawless.
Now the default Update Interval for Time Synchronization in Windows is 7 Days.
You can change how frequent Windows Synchronize with the internet time servers with a simple reg. entry.
HKLM_System_CurrentControlSet_servicies_W32Time\Config -------->UpdateInterval----604800
The amount 604800 is the amount of Seconds in 7 days,
You can change the amount to reflect how often your Computer Synchronizes.
Reboot after making the changes.
Another way is to run Task Scheduler to open Date an Time, when Windows Synchronizes Time.
I hope this will be helpful.
nighthunder.//
Another awesome link:
http://tf.nist.gov/tf-cgi/servers.cgi
Funny how the otherwise very useful post is listing exactly the one server that is no good out of all the good ones:
For some strange reason, unlike what everyone says on the web, my xp setting time interval place is here:

I changed it from a week (604800 seconds) to an hour (3600 seconds) and now it works perfectly.
Now let's go to see where it is on windows 7.
Damn. It turns out that:
http://stackoverflow.com/questions/...t-differ-from-controlset001-and-controlset002
...Yes, you only need to update the CurrentControlSet key...
ControlSet001 and ControlSet002 are alternating backups of CurrentControlSet, you don't need to update them.
So that guy up there was right and many others on the web were wrong. However he might have been wrong about the rest.
Now let's do it.
Yeah, he's wrong about "config". I have to go to "time providers" here as well. Damn moron.
Anyway, on w7 is the same exact thing as on xp:

There is one difference, in that it will not tell you when it has updated time, because in w7 actually they got rid of some information provided by xp, in line their making the subsequent product worse than the previous. Probably because for xp one guy was in charge and for w7 another guy was in charge. An idiot.
Last edited:
Yamato
Legendary member
- Messages
- 9,840
- Likes
- 246
luke wilson
All his movies are good and he never seems the same person. For example here he's playing with his brother, but they're playing two friends and you never remember once that they are brothers:
http://www.letbobwatchthis.org/watch-2901-Bottle-Rocket
Now I am watching this:
http://www.letbobwatchthis.org/watch-337-Henry-Poole-Is-Here
My favorite with him is Idiocracy.
Yamato
Legendary member
- Messages
- 9,840
- Likes
- 246
I need precisely 15 minute timeframe data from disktrading because I need to verify if my systems live on IB TWS execute exactly the trades that get backtested by tradestation on disktrading data. I need to see if my systems are doing live what they are supposed to do, to understand if their failure (when it is the case) is due to the system not working anymore or to the fact that it is not executing trades according to the backtests.
The world is plotting against me and disktrading has not replied after a whole two days since I sent them my email.
The world is plotting against me and disktrading has not replied after a whole two days since I sent them my email.
Adamus
Experienced member
- Messages
- 1,898
- Likes
- 97
I need precisely 15 minute timeframe data from disktrading because I need to verify if my systems live on IB TWS execute exactly the trades that get backtested by tradestation on disktrading data. I need to see if my systems are doing live what they are supposed to do, to understand if their failure (when it is the case) is due to the system not working anymore or to the fact that it is not executing trades according to the backtests.
So how are you going to carry out the test? I assume it will be in excel.
I need to do the same.
What do you want from it in terms of stats? You could look at the percentage of trades that are in the same direction and overlap in time, i.e. they both start either simultaneously or one after the other and then they exit similarly. Actually better defined: the percentage of time that both systems had a position in the same direction simultaneously as a fraction of the time that they had a position going in total. Which system's total time in the market though? The longest, the shortest or an average or the sum?
Oh, by the way, this thread rocks, :medieval: [EDIT: man!]
Yamato
Legendary member
- Messages
- 9,840
- Likes
- 246
Oh my god, dude, I'm like... I am SO Psyched!!!!! This is so cool that we're working on the same thing at the same time! :clap:
Like... yes, I will test it on excel. Totally.
Like... given the nature of my systems I only need the two sets of trades to match in days and direction: LONG trade on x day is a match. Forget about execution price, as I said many times before.
If there's more than 75% of them matching I'll be satisfied.
Oh, I forgot to add this:
:cheesy:
Please correct any English mistakes.
Last edited:
Adamus
Experienced member
- Messages
- 1,898
- Likes
- 97
Please correct any English mistakes.
You call that English?
You forgot to use the word "awesome".
🤢
What is it with :cheesy: ? This is obviously a graphic of a Japanese man with big teeth, yet when you hover over it, it says cheesy - is it because the Japanese man with big teeth just took his socks off? I admit that would be difficult to incorporate into the icon.
Yamato
Legendary member
- Messages
- 9,840
- Likes
- 246
Anyway, let's stop the smilies and let's start talking seriously again. Always make sure you reply to my thoughtful replies please. Or I'll reply to yours with smilies from now on.
Getting back to wise and intelligent and thoughtful mode, despite this world full of smilies and the "Smilies" tab right next to my advanced writing mode window... I am particularly bothered by the smiling ones and the one clapping and jumping up and down. The one with the thumb up bothers me as well.
Anyway, **** the goddamn smilies and let's get back to being totally serious.
My discretionary trading is still going on, as I still have not blown out my account, and it will go on like this for another few weeks until it will happen again. I hope it won't, but this has been the case until now.
So the first one was a trade on the GBP that I just couldn't miss. And it went perfectly, and gained 400 dollars.
Yesterday, somehow... once hooked on it... I felt the need for more of this drug. I saw an opportunity on the CL - even though it was not as big and evident as the previous one on the GBP - and I went for it.
Today I barely escaped losing a fortune, because last night I was happy to get out with just a profit of 130 dollars. My previous takeprofit would have barely been hit, but if it hadn't I would have lost 2000 dollars today, because it was a long trade and today the CL fell a whole lot.
So the pattern keeps happening as usual. First trade: great opportunity, almost certain success. Second trade, out of being addicted, was less of an opportunity and less of a success.
By the way, all bottom-picking trades.
Now the third trade should happen next week and it might or might not blow out my account, because the fact is that I take bigger and bigger risks if they work out. The first one was on the GBP, low leverage, low risk... the second one on the CL, with 10 times as much leverage. Not properly "leverage", but what I mean is that on the GBP I could lose 300, whereas on the CL I could lose 3000.
You get my point.
Now if I stopped trading for a month, I would get healthy again and the next trade would only be one of those huge opportunities where your success has a 90% rate. If I keep going, it will be less and less. Yesterday it was like 60%, with a screwed up risk/reward, because I had no stoploss in place as usual.
We'll see.
I am getting older and I might change. I feel less compulsiveness in everything I do. My posts are decreasing... my trades are decreasing... my energies are decreasing. It's all bad but it has the advantage of keeping me off discretionary trading.
I will be a balanced trader I think, by the time I reach 100.
Yamato
Legendary member
- Messages
- 9,840
- Likes
- 246
Yamato
Legendary member
- Messages
- 9,840
- Likes
- 246
luke wilson 2
http://www.trade2win.com/boards/trading-journals/85510-my-journal-2-a-127.html#post1225682
I was wrong. This movie is unwatchable:
http://www.moviesonlineathome.com/watch-337-Henry-Poole-Is-Here
But maybe it's good. It is just sad. No, it sucks. Wrong script. Nothing wrong with director or actors. Just awful script.
Yamato
Legendary member
- Messages
- 9,840
- Likes
- 246
Ok, I have the data
I finally have the data and now I will have to verify if the back-testing on this last year matches the trades that were made in forward-testing.
DONE (later edit): good results for the first system tested, ZN_ON.
I finally have the data and now I will have to verify if the back-testing on this last year matches the trades that were made in forward-testing.
DONE (later edit): good results for the first system tested, ZN_ON.
Last edited:
Yamato
Legendary member
- Messages
- 9,840
- Likes
- 246
latest attempt at pivot system
I had the pivot system all set up on tradestation, so before removing it I gave it one last try. Now I will remove it, but since it doesn't work, I will post it here.
It doesn't work in the out-sample.
In the in-sample it works perfectly.
Here is the code:
Here's the equity line for the in-sample:

Here's the equity line for the in+out-sample:

You can see what I mean when I say that it doesn't work (at all) in the out-sample.
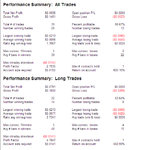
Here's the report, for the in-sample (i could not export the xls file, because there's that bug again):

The one for the whole in+out sample looks too bad to even worry about posting it.
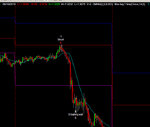
There must be something good in this system, because it looks good on the chart and it does exactly what i want it to do:

I had the pivot system all set up on tradestation, so before removing it I gave it one last try. Now I will remove it, but since it doesn't work, I will post it here.
It doesn't work in the out-sample.
In the in-sample it works perfectly.
Here is the code:
Code:
Inputs: test(0), test2(0), test3(0);
variables: Pivot(0), R1(0), S1(0), nearness(0), trailing(0), ma_entry_value(0), ma_exit_value(0),stoploss_value(0);

Pivot = (HighD(1) + LowD(1) + CloseD(1))/3;
R1 = 2 * Pivot - LowD(1);
S1 = 2 * Pivot - HighD(1);

nearness = 0.0015;
ma_entry_value = 14;

trailing = 0.0045;
ma_exit_value = 4;
stoploss_value = 0.0050;


If marketposition = 0 and date>=1100505 and entrydate(1) <> date then begin

If lowd(0) < Pivot  and lowd(0) > Pivot - nearness
and lowd(0) < AverageFC(c, ma_entry_value)
Then buy("Long") this Bar;

If highd(0) > Pivot and highd(0) < Pivot + nearness
and highd(0) > AverageFC(c, ma_entry_value)
Then sell("Short") this Bar;

end;


If c > r1 - trailing and c < AverageFC(c, ma_exit_value) then exitlong ("L trailing exit") this bar;
If c < s1 + trailing and c > AverageFC(c, ma_exit_value) then exitshort ("S trailing exit") this bar;

If openpositionprofit < -stoploss_value then exitlong ("L stoploss") this bar;
If openpositionprofit < -stoploss_value then exitshort ("S stoploss") this bar;
Here's the equity line for the in-sample:

Here's the equity line for the in+out-sample:

You can see what I mean when I say that it doesn't work (at all) in the out-sample.
Here's the report, for the in-sample (i could not export the xls file, because there's that bug again):

The one for the whole in+out sample looks too bad to even worry about posting it.
There must be something good in this system, because it looks good on the chart and it does exactly what i want it to do:

Last edited:
- Status
- Not open for further replies.
Similar threads
- Replies
- 10
- Views
- 3K
