RedGreenBen
Well-known member
- Messages
- 268
- Likes
- 52
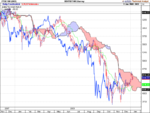
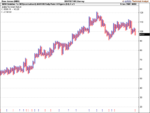
Good news, I took my own advice and shorted below 485
Bad news, I got out probably too early at ~455
Bad news, I got out probably too early at ~455
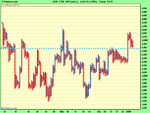
Anybody keen to predict an intraday low?
Current bounce looks like oversold more than anything else.
Even I think it's oversold right now, for the day. Retrace to 4475, and wobble indecisively around it.
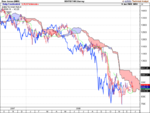
I'm now happy to take 20 points on this final short, nothing to do with maintaining my winning run, I'm too clever to fall into psychological traps like that 🙂
I'm now happy to take 20 points on this final short, nothing to do with maintaining my winning run, I'm too clever to fall into psychological traps like that 🙂
I'm still thinking 450 area is a hard nut to crack.
Ben
(At least you are earning money from the day job)
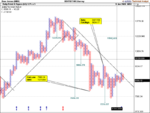
Gave up and closed out at £10 down. Naturally, it's now trading at £35 up, £75 up on the far side of the spread. Really glad for the day job. Thinking I'm going to give up on the serious trading stuff, go back to spread betting. I was making good money there, but don't have the nerve for the minimum trades on a proper brokerage.