wallstreet1928
Legendary member
- Messages
- 6,609
- Likes
- 89
Market is already getting obliterated at the open............DOW 7000
CMC markets opens @ 23.00 for US markets only and i think 00.00 for European Indices so I don't know what's happening there there yet!!
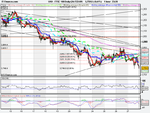
but according to IG the FTSE index is already trading around 3770 region so not looking good.......!
it needs to hold this level or its going to get ugly......
Sir William has stated that we may see a correction in the interim according to his Elliot wave count........
CMC markets opens @ 23.00 for US markets only and i think 00.00 for European Indices so I don't know what's happening there there yet!!
but according to IG the FTSE index is already trading around 3770 region so not looking good.......!
it needs to hold this level or its going to get ugly......
Sir William has stated that we may see a correction in the interim according to his Elliot wave count........