Would be nice to see some examples of what people do with their charts to prepare for the week ahead and how you read where the action will go based on trendlines, s/r, MAs etc. I know some of you guys have been making quite solid predictions in the area where indices are headed but it would be really helpful to see how you come to these conclusions from chart examples. Anyone fancy sharing some info this weekend? I don't mind putting something up but I expect most of you are far beyond my stage of enlightenment!! 🙂
Hi Richard,
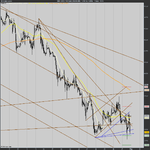
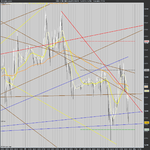
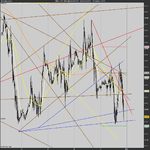
I've attached 3 charts for you. 1 hr, 15 min, 5 min. I've wisely started doing my overall analysis on the hourly chart now - I was using 15min, but it seems after all, there is no point. But, I still do some fine tuning analysis on the 15min, and sometimes a bit more on the 5 or 3 min.
I think most people are using 200ma, 50ma, and 20ma. I'm sure they will shout if that's not the case. I've ditched all my indicators, save for RSI 5, on the hourly. Still using fibs too.
My charts show major trendlines and channels I have identified. Not that I always manage to get them drawn accurately... and I did get screwed last week for that reason! So, it's really worth taking your time to draw them as precisely as possible IMO. It takes a while to really see clearly where the trends are, so it can take a bit of practice to be spot on. After some months, I'm still learning for sure.
As for predictions in price movement. I've been a bit hit and miss at times, but recently I have started county waves, as in Elliot Waves (whole new subject, but worth some research I think). Also, I look to see how the market tests trend lines, S/R levels. If there are repeated tests, then a breakout, that's a soild indicator for a change in direction IMO.
Anyway, I think Wallstreet is your man for a better explanation. From what I read on Friday, he was spot with his analysis. Not that I would want to boost his ego at all
😉 I jest!
Cheers, Ollie
p.s. I have also started using a 15min Renko chart, which seems to be good for smoothing out the noise. And again, I draw trendlines on that too. I'm not 100% I shall stick with it though.... there's potential for information overload sometimes I think.


