Message For Ftse Traders......

What are your views on time frames for trading?

Situation just arose: on 10 minute chart a hammer candle marked my entry on a pullback trade, which then took my stop loss.

I then looked back to the 2 min chart, and on that a clear reversal had taken place and my hammer candle for the downside was a pullback on the 2 min in the new uptrend, causing the dillema of what to use.

Thoughts?
 
timeframes for trading....use the alexander elder method..ie multiples of 5
so a 1 min trigger with 5 and 30 mins
 
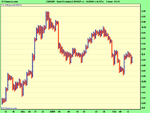
eurgbp..this wont capitulate in an orderly manner.been creating lots of shorting opportunities though.its back in the death zone again.it is a slow painful death
 

Attachments

  • dying off.png
    dying off.png
    12.7 KB · Views: 98
i had an email today.there is a technical analysis conference and exhibition in paris on march 20 and 21 .tickets are free.i think the day trip on eurostar can be had for £50
anybody,interested then pm me
it is at the espace cardin near the eurostar terminal
 
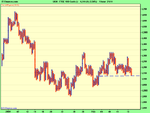
ftse 100..horly data
10 pint box size .3 reversal..hilo data
this chart is really messy now.the only thing i can see is bounces off a support line.resistance areas are scattered all over the place
 

Attachments

  • back.png
    back.png
    13.6 KB · Views: 109
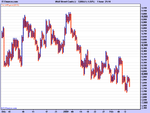
dow..the 8000 was the resistance
hourly data.25 point box size.3 reversal.hilo data plot
 

Attachments

  • 8000.png
    8000.png
    15 KB · Views: 124
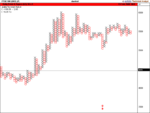
a flipped chart of the ftse100.basically,the chart is turned upside down.it is supposed to make it easier to find a trend.........!!!!!!!!
so if you stand on youre head and look at this flipped chart you might find a trend.you will probably get vertigo while you are looking at the chart
eod data.50 point box size 1 box reversal hilo plot
 

Attachments

  • flipped.png
    flipped.png
    28 KB · Views: 108
well.posting a chart with comments gives me a record of what i was thinking at the time.whether it be right or wrong.the best way i have learnt over the time is to take criticism from other traders.this is by far the best learning mechanism.so feel free to tell me what you think.the other thing that is useful is to go back to the posts and see what went right and what went wrong previously.and try and learn a bit more
so,wallstreet,if you have the software ,please could you post some market profile charts.
every little helps..!!
 
Last edited:
according to robert mchugh at technicalindecatorindex.com
there are huge bullish divergences in the 10 day advance and decline indecator suggesting that a reaonable rally is going to start.these are in all the major us indices
these are his thoughts.it is a paid for service
so we wait to see
 
some market profile basics fo our veiwers
wallstreet:there are some traders on elitetrader who have coded tpo/mp in easy language.this can be coded, i think into ig charting.
 

Attachments

some market profile basics fo our veiwers
wallstreet:there are some traders on elitetrader who have coded tpo/mp in easy language.this can be coded, i think into ig charting.

Hi Dentist,
Interested in the mp coding you mention on elite. I've been trawling through the forum but couldn't find the thread. Any chance you could post a link if you know?
Thanks
KJ
 
there are posts on et by tums.he has coded many indecators.he says on one post thta he has put the code for mp/tpo on a later page.if you cannot find it ,then pm him.i am sure he will help.it will save you alot of money.as the software vendors charge extra for mp
 
there are posts on et by tums.he has coded many indecators.he says on one post thta he has put the code for mp/tpo on a later page.if you cannot find it ,then pm him.i am sure he will help.it will save you alot of money.as the software vendors charge extra for mp

thank you dentist, i really appreciate it
 
yeah...its in the amibroker library.other users saying that there some small errors in the code.but the basics i think are there.
wallstreet / kitejedi are you progarmmers.???
 
Back
Top