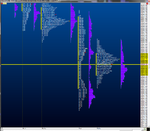
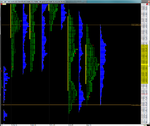
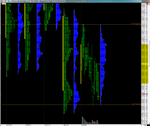
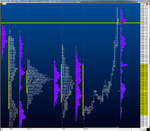
Market Profile - Daily updates

8/3/15 Morning Update 0600am PST.

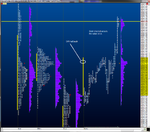
Volume is light; 148K. O/N inventory is net short but not 100%. O/N High is 2102.5 and O/N Low is 2092.75. Most of the activity has been inside Friday's range. I'm applying balance rules for my trade today. If the mkt breaks out of balance to the downside and finds acceptance, my targets will the poor lows discussed in Friday's recap. If the trades to upside out of balance and accelerates, the mkt could attempt to take the highs from 7/31 (2108.5), 7/23 (Poor at 2110.5), 7/22 (2112).
 

Attachments

  • Overnight1.png
    Overnight1.png
    145.5 KB · Views: 171
8/3/15 Recap and prep (for 8/4).

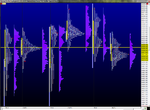
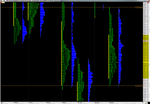
Higher volume and lower value implies that the market is very weak. Even with the weakness the mkt was able to retrace more than half that into the close. 1T.F. has ceased on the daily chart. On the same timeframe, we are now out of balance to the downside. In the short term, the anomalies from 7/28 may now become the focus for day timeframe traders. Last weeks low is also a poor low at 2056.5. This could also be a destination trade should the mkt continue its weakness going fwd. Something Im going to be eyeballing this week is on the weekly chart. Ive drawn a level at 2073.50. It's about the center of this 20+ week balancing bracket and was a double top on the last week of '14 and first week of '15. May not mean anything. But the evidence on the weekly chart shows that the mkt keeps being drawn to and from this level. So Im keeping this in my mind. I also have drawn a trend line on the weekly chart. Im also keeping this in my mind as well. Should both of these levels be breached, and prices are accepted below these levels, taking out last weeks low could be a real possibility. This mkt continues to exhibit very low confidence. The ES today was heavily influenced by the other majors (YM, NQ, TF).
 

Attachments

  • Weekly.png
    Weekly.png
    45 KB · Views: 158
  • Daily.png
    Daily.png
    36.3 KB · Views: 178
  • Profile1.png
    Profile1.png
    105.7 KB · Views: 166
  • Profile2.png
    Profile2.png
    121 KB · Views: 189
8/4/15 Morning Update.

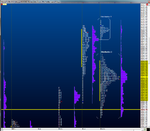
O/N volume is very light. 127K at 0540am PST. Adjust expectations. O/N trade is within yesterdays range, and inventory is relatively balanced - somewhat short. Balance Rules apply. 1) Stay within balance and rotate. 2) look above or below and accelerate. 3) look above or below and fail. A couple of dest. trades should we find acceptance outside of balance could be (upside) the prominent TPO POC from 7/31 at 2105.5, and (downside) the center of the 20+wk balance we have been in at 2073.5. O/N high is 2093.5 and the low is 2084.25.
 

Attachments

  • Overnight2.png
    Overnight2.png
    111.5 KB · Views: 164
  • Overnight1.png
    Overnight1.png
    114.9 KB · Views: 169
8/4/15 Recap and prep (for 8/5).

A day of balance. Within this balance the attempted direction being down and lower volume implies balance as well as a strengthening mkt. Sellers were taking advantage of every attempted rally. Today's TPO POC is very prominent and virtually in the center of today's range. There are several data points that could support a mkt that is poised to go in either direction. I will leave todays recap at that. Until this mkt shows some form of directional performance and confidence, trying form a bias in either direction may cause cognitive dissonance. Speaking of confidence, in a low confidence environment, the mkt can easily be controlled by day timeframe traders. What Ive learned from Jim Dalton's classes is that these are the most emotional type of traders. The usual day timeframe levels (O/N high/low, prior pit session high/low, etc..), but also trend lines may come into the game. Ive drawn two very short term trend lines on a daily pit session template chart that you may want to reference. At any rate, let the mkt reveal its intentions through market generated information. Tomorrow has several potential market moving news events. See them here: http://www.forexfactory.com/
 

Attachments

  • Daily.png
    Daily.png
    51 KB · Views: 157
  • Profile1.png
    Profile1.png
    135.7 KB · Views: 157
  • Profile2.png
    Profile2.png
    129.6 KB · Views: 186
8/5/15 Morning Update

Volume is moderate 173K. O/N inventory is 100% long, and as of now (0540am PST) there is a 7 handle gap up. From Mind Over Markets: "gaps are measured from previous pit session high or low, not the settle."
Gap rules apply.
1. Go with all gaps that don’t fill right away. That means if it doesn’t back off early it’s probably not going to and is going higher.
2. Large gaps (this is not really one) may not fill or may fill only partially on the first day. Pay attention to “halfback” of the gap distance. Currently the 2099 area.
3. If the gap fills and value cannot get to at least overlapping, there will probably be a late day rally.
There is still news that has to come later that potentially can move the market. Be mindful of them.
 

Attachments

  • Overnight2.png
    Overnight2.png
    132.8 KB · Views: 168
  • Overnight1.png
    Overnight1.png
    149.4 KB · Views: 239
8/5/15 Recap and prep (for 8/6).

Slightly higher volume today. Attempted direction was up from the open. But there were sellers waiting around the level of the very prominent TPO POC from 7/31 at 2105.5. Traders had last weeks high at 2108.5 in their sights and that's what my mindset was as well since the attempt to fill the gap failed. But sellers were able to drive mkt down for the remainder of the day. One thing I want to point out is regarding the GAP rules. Rule 3 states: "If the gap fills and value cannot get to at least overlapping, there will probably be a late day rally." The gap was filled in F period, but value was no where close to overlapping. I was prepared for a late day rally, waiting patiently. In J period, we started to get that rally as we started to 1T.F. higher, above the I period high. This was one of the trades I was long in. However, once K period opened up, value migrated to overlapping. This alerted me to the fact that the odds of upside continuation had just been lowered substantially. I took the trade off but atleast was able to grab 1handle of profit. The point is, it's a great help to keep these market profile nuances in your mind. They work. Once price got to half back (2098.75), the mkt sold off into the close. Short lived late day rally.
On a daily level we are in a 6 day balance bracket. Even with todays action, we are now 1.T.F higher again on a daily chart.
Long winded recap today, apologies.
Ive included a birds eye view of the daily profiles today. On this figure I have all of my levels marked that Im prepared to monitor price action around these levels.
I also post these recaps on my FB page: https://www.facebook.com/pages/D%C3%B6bler-Derivatives-LLC/294362757431510?ref=hl
 

Attachments

  • Daily.png
    Daily.png
    37 KB · Views: 153
  • Profile1.png
    Profile1.png
    137.9 KB · Views: 219
  • Profile2.png
    Profile2.png
    163.1 KB · Views: 165
8/6/15 Morning Update

0545am PST. Volume very light: 100K. O/N inventory is balanced. Mkt in balance. Balance rules apply.
1) Remain within balance.
2) Look above or below and fail; on a failure the opposite extreme becomes the destination trade.
3) Look above or below balance and accelerate.
Yesterday's recap pointed out that on a daily basis we are in a 6 day balancing bracket as well. A breakout that accelerates would target these extremes (2108.5; also a weekly high. 2080)
O/N High is 2099.25
O/N Low is 2091
 

Attachments

  • Overnight2.png
    Overnight2.png
    133.3 KB · Views: 163
  • Overnight1.png
    Overnight1.png
    138.4 KB · Views: 179
8/6/15 Recap and prep (for 8/7).

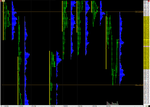
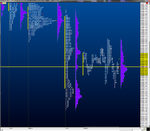
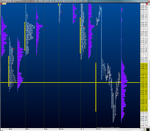
Higher volume and lower value indicates a very weak market. Quite honestly I am having a hard time deciphering today's profile. At first glance I want to say long liquidation. But we've had several days of balance. This piece of data doesn't support long liquidation. Substantial volume and extended range could be an indication of new selling vs. long liquidation. However, the profile lacks symmetry which is often how the profile appears if longer term participants were in control. Nonetheless, we are out of balance to the downside. A late day rally made an attempt to get back into the 6 day balance bracket but failed to find acceptance. However the mkt settled just below the balance low (balance low is 2080), at 2079.75
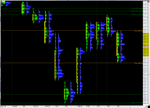
I've left the lower balance bracket level drawn on the profile img for reference. Also take a gander at the daily chart posted. Interesting how the low of the day is virtually the uptrend line drawn. Ive looked at the 200 day MA too, it and the trendline are just about the same level.
My trading today started off with a profit on the 1st trade. But trying to catch the low early came back to me in the form of hell in a hand basket. I stepped away at this point. I couldnt get my head around the facts that were right in front of me. Best thing to do when this happens is to sit on hands.
A couple things to keep in mind going into tomorrow;
1) If in fact today was new money selling (institutional), I think we will see more weakness. If the 200 day and the trendline are breached all sorts of participants may pile on.
2) Today's auction has an excess low. This typically marks the end of an auction. Although the next auction may still be to the downside. But the fact that we have an excess low today is something to put in the back of your mind.
3) If today was day and shorterm participants liquidating or not, there are alot of shorts in the market.
Summary, obviously the mkt could go in one of two ways - balance. But if there is a short covering rally, it could be a mirror of today at least in the am session.
Big news events pre-mkt tomorrow. Lots of stuff to be very alert about. You can find news events at Forex Factory website.
I hope this helps with your preparation.
 

Attachments

  • Weekly.png
    Weekly.png
    40.8 KB · Views: 154
  • Daily.png
    Daily.png
    39.1 KB · Views: 156
  • Profile1.png
    Profile1.png
    196 KB · Views: 174
  • Profile2.png
    Profile2.png
    190.7 KB · Views: 165
Higher volume and lower value indicates a very weak market. Quite honestly I am having a hard time deciphering today's profile. At first glance I want to say long liquidation. But we've had several days of balance. This piece of data doesn't support long liquidation. Substantial volume and extended range could be an indication of new selling vs. long liquidation. However, the profile lacks symmetry which is often how the profile appears if longer term participants were in control. Nonetheless, we are out of balance to the downside. A late day rally made an attempt to get back into the 6 day balance bracket but failed to find acceptance. However the mkt settled just below the balance low (balance low is 2080), at 2079.75
I've left the lower balance bracket level drawn on the profile img for reference. Also take a gander at the daily chart posted. Interesting how the low of the day is virtually the uptrend line drawn. Ive looked at the 200 day MA too, it and the trendline are just about the same level.
My trading today started off with a profit on the 1st trade. But trying to catch the low early came back to me in the form of hell in a hand basket. I stepped away at this point. I couldnt get my head around the facts that were right in front of me. Best thing to do when this happens is to sit on hands.
A couple things to keep in mind going into tomorrow;
1) If in fact today was new money selling (institutional), I think we will see more weakness. If the 200 day and the trendline are breached all sorts of participants may pile on.
2) Today's auction has an excess low. This typically marks the end of an auction. Although the next auction may still be to the downside. But the fact that we have an excess low today is something to put in the back of your mind.
3) If today was day and shorterm participants liquidating or not, there are alot of shorts in the market.
Summary, obviously the mkt could go in one of two ways - balance. But if there is a short covering rally, it could be a mirror of today at least in the am session.
Big news events pre-mkt tomorrow. Lots of stuff to be very alert about. You can find news events at Forex Factory website.
I hope this helps with your preparation.


excellent stuff mate.keep it up.

space the text out a bit if you can.(realise you are squeezing a lot of detail in there though)
 
Friday morning

8/7/15 Morning Update. 0545am PST. Moderate volume 177K. As of now the mkt would be opening in balance. O/N inventory is short but not 100%. Review yesterday mornings post for balance rules. Thanks.
UPDATE: removed the bearish reaction comment about the news release, of course after the post, the mkt turned around and created a new O/N high. Sorry about that.
 

Attachments

  • Overnight2.png
    Overnight2.png
    117.9 KB · Views: 162
  • Overnight1.png
    Overnight1.png
    111 KB · Views: 187
Last edited:
8/7/15 Recap and prep (for 8/10).

Lower volume w overlapping to lower value implies a moderately weak mkt. A late day short covering rally brought the settle (2073.75) almost to the open (2075.50). Which, is virtually the center of the range of the 25 week balance bracket. 3 ticks of excess on the low today. This excess low shows well on the daily chart. The low of the day coincides for all intent, exactly with the intermediate term uptrend on the weekly chart. Last week was an inside week as well. Still 1T.F. lower on a weekly and daily basis, and Friday left a very prominent TPO POC at 2065. There is still a poor low left from the previous week (7/27). These could be targets should the mkt trade to the downside. Last week was an inside week which is another form of balance. This market has very low confidence. Will provide an update pre-mkt.
 

Attachments

  • Weekly.png
    Weekly.png
    38.3 KB · Views: 149
  • Daily.png
    Daily.png
    40.3 KB · Views: 156
  • Profile1.png
    Profile1.png
    139.6 KB · Views: 146
  • Profile2.png
    Profile2.png
    118.4 KB · Views: 155
8/10/15 Morning Update

Moderate volume as of 0545am PST; 168K. O/N inventory is 100% long, and at this time there is an 11 handle gap up. Gap rules apply:
1. Go with all gaps that don’t fill right away. That means if it doesn’t back off early it’s probably not going to and is going higher.
2. Large gaps may not fill or may fill only partially on the first day. Pay attention to halfback of the gap distance (2080)
3. If the gap fills and value cannot get to at least overlapping, there will probably be a late day rally.
O/N high is 2088.5 - but with the mkt being bid all night this likely will not hold long.
O/N low is 2071.75
Gaps are measured from the prior pit session high or low, not the settle.
 

Attachments

  • Overnight2.png
    Overnight2.png
    131.5 KB · Views: 152
  • Overnight1.png
    Overnight1.png
    138 KB · Views: 153
8/10/15 Recap and prep (for 8/11)

Lower volume with a substantial gap that held, and higher value - translates to a confident day. The mkt didnt look back all day except in the pm session in 'M' period. This I thought was going to be a nice liquidation. Because, most of the day was grinding and slow; add in the gap, and I formed the opinion that there were many longs accumulated. Wrong opinion. Thankfully I didnt risk much on this short trade I took.

In preparing this recap I have noticed something that would've been nice to be aware of during the day. From an article written by Jim Dalton: 'The most potent combination is excess followed by a gap.' Friday had excess (low) that is very visible on the daily chart. Price action today accelerated off of the 200 day MA as well, another data point to carry fwd.

If there's more upside tomorrow, the destination will be the top of the weekly balance bracket (2126.25)
If we trade to the downside, the first dest would be the pit low today (2086), if there is no rejection at this level, the mkt could accelerate filling the gap. Gaps are considered single prints, and are a form of excess too. When price retraces single prints, it has a tendency to accelerate due to poor structure.

***** Conflicting Info *****
Positive********************
1) Gap held
2) Open-Drive today. The definition is way too long to post here. But here's a small def.: "Strongest. Generally caused by other timeframe participants who have made their market decisions before the opening bell"
3) 1 T.F. higher on Daily level
Negative:*******************
1) The profile today is classic short covering shape (poor high with a 'p' pattern and the open was basically the low of the day)
2) Mkt intermediate term has very low confidence.
3) 25 week balance bracket
4) The week ending 8/1 left a weekly poor low (on 7/[email protected])
 

Attachments

  • Weekly.png
    Weekly.png
    35.6 KB · Views: 169
  • Daily.png
    Daily.png
    50.8 KB · Views: 143
  • Profile1.png
    Profile1.png
    172.6 KB · Views: 153
  • Profile2.png
    Profile2.png
    147.6 KB · Views: 147
Do you look at the composite profiles and trade the larger developing value areas?
The weak high and daily wedge with a strong excess low look like we have higher to probe - however a push higher will be into the larger time frame range high. Could see this setting up for a break of the inside week high, unlock some volume and roll back over again.

I haven't been watching the ladder for over a month though!

Good luck.

Thanks. I dont look at the larger profiles. But I see the wedge youre talking about. Getting wound tight
 
8/11/15 Morning Update

High volume over night, 257K at 0545am PST. Double distribution and as of now we have a small gap down of about a handle. China has devalued their currency, this has contributed to the O/N volatility. Also, O/N activity confirms yesterday as being dominated by short covering. On the daily chart, there is a definite wedge forming for some days now. The mkt is getting wound tighter and tighter.
O/N inventory is almost 100% short.
O/N High is 2101.75
O/N Low is 2083.25

ps - this site was down for a while this am. I couldnt post earlier.
 

Attachments

  • Overnight2.png
    Overnight2.png
    137.7 KB · Views: 170
  • Overnight1.png
    Overnight1.png
    117.7 KB · Views: 163
8/11/15 Recap and prep (for 8/12).
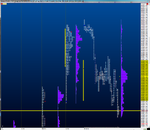
Higher volume and lower value imply a very weak market. However there are some data points that are contrary (at least in the short term). They are:
> The ES is holding above its 200 day MA. In fact bounced off of it today.
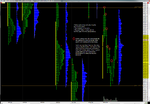
> Circled on the daily chart are three daily bars that show excess on the lows. Each of these auctions have completion (to the downside)
> The ES is remaining above the daily trendline. It's looked below on two occasions and did not find acceptance.

Sellers were present at every rally today. However, once they couldn't press the mkt any lower, in 'J' period the short covering rally took control into the close to settle exactly at halfback.

Once the gap from overnight was filled the market did accelerate to the downside closing the gap from yesterday. We are just above the center of the 25 week balance bracket. I really have no bias to hold going into tomorrow. With the way mkt has been trading recently, there would be no surprise in either direction. That's how Im preparing my mindset.
 

Attachments

  • Weekly.png
    Weekly.png
    72.4 KB · Views: 157
  • Daily.png
    Daily.png
    45.4 KB · Views: 168
  • Profile1.png
    Profile1.png
    151.7 KB · Views: 168
  • Profile2.png
    Profile2.png
    142.3 KB · Views: 150
8/12/15 Morning Update.

High volume overnight, 392K as of 0540am PST. China's nonsense has railed our mkt's overnight. Range is 31.5 handles, the high is 2085.25 and the low is 2053.75
Currently, a gap of 6 handles to the downside. So, gap rules apply once again. They are listed in 8/10's Morning Update for reference.
O/N Inventory is very short. Since yesterdays pit low is 2070.75 and is about 3 handles (2073.5) away from the center of the 25 week balance bracket, I'm using the pit low as a go no/go level. If the gap doesnt fill, the bottom of the bracket could be a destination trade at 2023. If we can find acceptance back in yesterdays range, all auctions remain to the upside.
 

Attachments

  • Overnight2.png
    Overnight2.png
    113.7 KB · Views: 148
  • Overnight1.png
    Overnight1.png
    116 KB · Views: 142
8/12/15 Recap and prep (for 8/13).

Substantial volume and range today. Beautiful buying tail in 'B' period with only 18 contracts on the low. Today's auction to the downside off the open repaired the poor low from 7/28 (also a weekly low). There are no more anomalies to the downside as far as the profile is concerned. This is positive for upside continuation.
Put another way, the short term auction to the downside is complete. This in no way doesnt mean there couldnt be a new auction to the downside.
The exception is today's profile, stretched out like it is, there are a few anomalies left behind (flat spots on the profile). Unless the mkt trades to the downside in the near future, these are not important.
We are still 1 T.F. lower on a daily and weekly basis. Today's action settled right on the highs. Another positive data point to carry forward.
*********** Conflicting Info **************
Positive:
> All auctions to the downside are complete (short term)
> Excess low on todays profile.
> It was obvious today there was new money buying as opposed to the rally we saw just consisting of short covering.
> 2 poor highs above (attracts mkt to repair)
Negative:
> Intermediate time frame - very low confidence
> 25 week balance bracket
> World events; e.g., China
> 1 T.F. lower on Daily and Weekly timeframes
 

Attachments

  • Daily.png
    Daily.png
    48.8 KB · Views: 148
  • Profile1.png
    Profile1.png
    173.8 KB · Views: 160
  • Profile2.png
    Profile2.png
    188.5 KB · Views: 163
Top