Market Profile - Daily updates

8/13/15 Morning update

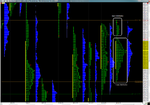
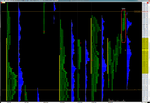
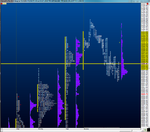
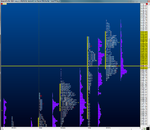
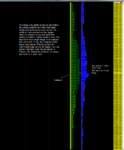
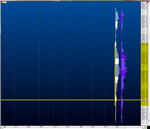
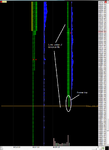
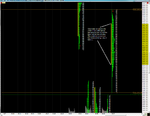
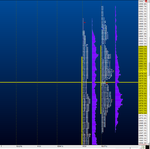
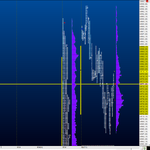
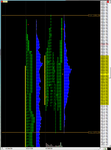
. O/N inventory is long but not quite 100%. As of 0540am PST, we have a gap up of 3 handles. The mkt is out of balance to the upside. Gap rules apply. They are posted in 8/10's morning update for reference.
Volume moderate: 185K
O/N high 2093
O/N low 2076
Prior pit session high 2084.75
Prior pit session low 2046.5
 

Attachments

  • Overnight1.png
    Overnight1.png
    105 KB · Views: 217
  • Overnight2.png
    Overnight2.png
    117.3 KB · Views: 253
8/13/15 Recap and prep (for 8/14)

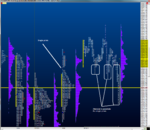
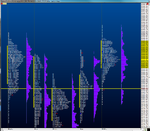
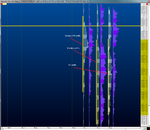
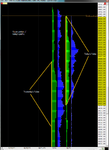
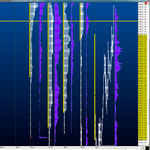
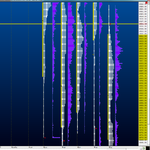
Lower volume and higher value today. Yet, the attempted direction was: no direction. The mkt sold off shortly after the open and found balance around the O/N low and when sellers could not press it beyond that area, buyers prevailed. Similar reaction when buyers dried up around the pit session high of 2088.25 from 8/11, classic late day long liquidation. Technically, 1 T.F. lower has ceased on a daily level. The settle is 2 ticks below halfback (2080.5). So, no winners today. This is real obvious on the daily chart.
We do have a poor high left today. Something Ive noticed in this week's of profiles;
Every low has had excess, and 3 days of the 4 have had poor highs. Im still a student, but to me, this feels like buyers really want to push the market higher. Poor highs are an indication of traders getting the market too long for the probe to continue higher. Does this translate to anything meaningful? I dont know, but if the mkt makes a move higher tomorrow, Im going to be ready for it. I'll change my bias on a dime if it goes lower simply because of the low confidence we've been in for 25 weeks now
 

Attachments

  • Daily.png
    Daily.png
    47.7 KB · Views: 245
  • Profile1.png
    Profile1.png
    166 KB · Views: 228
  • Profile2.png
    Profile2.png
    204 KB · Views: 231
8/14/15 Morning Update

Volume if moderate, 155K at 0545am PST. O/N inventory is balanced and the mkt is in balance (inside yesterday's range). Balance rules apply.
1) Remain within balance. Rotational and limited opportunities, so adjust expectations.)
2) Look below or above balance and fail. A failure targets the opposite extreme.
3) Look below or above and accelerate.
Yesterday's pit session low (2073.25) is my go no/go level as this is a tick away from what has been the center of the 25week balance. It is also very close to the 200 day MA. So should the mkt find acceptance below this level, the target becomes the lower extreme of the balance (2023).
O/N high 2085.25
O/N low 2073.75
Prior pit session high 2089
Prior [it session low 2073.25
 

Attachments

  • Overnight2.png
    Overnight2.png
    138.9 KB · Views: 234
  • Overnight1.png
    Overnight1.png
    131.5 KB · Views: 227
8/14/15 Recap and prep (for 8/17).

For most of Friday's session the mkt was in balance spending a lot of time around the TPO POC at 2083. This POC is a very prominent one. We had a late spike, a small one but still technically a spike with only 2 ticks of excess separating the two distributions. For Monday finding acceptance in the upper portion of the spike is positive. A target would be the poor high from 8/10 (2100.75). Finding acceptance below the spike will target the very prominent TPO POC, and possibly Friday's pit session low (2076).
1 T.F. higher on a daily basis.
1 T.F. lower on a weekly basis.
There's an obvious wedge forming on the daily chart.
Still holding above the 200 day MA, positive.
 

Attachments

  • Weekly.png
    Weekly.png
    62.6 KB · Views: 178
  • Daily.png
    Daily.png
    100.8 KB · Views: 201
  • Profile1.png
    Profile1.png
    178.6 KB · Views: 146
  • Profile2.png
    Profile2.png
    168.1 KB · Views: 228
08/17/15 Morning Update.

O/N Volume is moderate; 186K as of 0555am PST. Most of the activity O/N has been on the edge of being out of balance to the upside. But, is now making new lows. The expanded profile shows 3 attempts overnight testing the single prints from Friday's profile, driving lower on the 3rd. Looks like now we may be opening within Friday's range, around the TPO POC area.
O/N Inventory appears balanced.
O/N high 2094.5
O/N low 2079.5
Prior Pit high 2089.75
Prior Pit low 2076
 

Attachments

  • Overnight2.png
    Overnight2.png
    169.6 KB · Views: 194
  • Overnight1.png
    Overnight1.png
    144.7 KB · Views: 154
08/17/15 Recap and prep (for 8/18)

Higher volume and overlapping to higher value implies a moderately strong mkt. Looking at strictly price one would come to the same conclusion. But, for the profile, looking through its lens, we have a very poor structure. Technically 5 distributions. Ive never seen 5, maybe 4 once. A distribution is separated by single print TPO's. The number of distributions combined with anomalies (flat spots on the profile) indicates day and short term traders controlling today's action, very emotional.
We also now have a weak high. A weak reference is when price comes within 1 tick of a previous reference. Today's high is 1 tick below last week's poor high on Monday.

I would like to see continuation Tuesday as we have broke through the short term down trendline on the daily chart.

***** Conflicting Info *****

Positive******
1) Outside day (to friday); bullish
2) 1 T.F. higher on daily
3) Value and TPO POC migrated w price
4) Excess low on today's profile

Negative*****
1) Very poor profile structure
2) Low confidence mkt over all
3) 26wks of zero direction; balance.
 

Attachments

  • Daily.png
    Daily.png
    77.2 KB · Views: 243
  • Profile1.png
    Profile1.png
    167.4 KB · Views: 214
  • Profile2.png
    Profile2.png
    201.2 KB · Views: 235
8/18/15 Morning Update.

Volume is light; 154K as of 0535am PST. I'm calling O/N inventory short since when looking at the expanded profile, most of the trading has been to the downside. Collapsed would give one a balanced inventory. However, I'm going to apply balance rules today in my trading. They are:
1) Look above or below balance and fail. Which would target the opposite end of the range
2) Remain in balance.
3) Look above or below balance and accelerate.
Keep in mind that yesterday was dominated by day timeframe traders (left the very poor structure). So there are alot of longs from yesterday. Possibly a liquidating break should the mkt open with confidence to the downside.
 

Attachments

  • Overnight1.png
    Overnight1.png
    118.9 KB · Views: 142
  • Overnight2.png
    Overnight2.png
    113.2 KB · Views: 230
08/19/15 Morning Update.

Fitting in a short recap, as I was unable to post one after mkt close yesterday. Yesterday was a balancing day. The profile has left a poor low and a combination of a poor and weak high. These are also combined with two other days of poor highs covered in a previous post. Now, these three days are exponentially potent to be repaired (repaired is being revisited by the mkt- only during pit session hours). Carry this fwd.
O/N Volume is moderate at 179K as of 0545am PST.
O/N inventory is short but not 100%.
As of now there is a 3 handle gap (gaps for profile concerns are measured from the previous pit high or low, not the settle). Gap rules apply.
1) Go with all gaps that dont fill right away.
2) If the gap fills and value cannot get to at least overlapping there will probably be a late day rally in the direction of the gap.
O/N high 2098
O/N low 2084
Prior pit high 2100.25
Prior pit low 2090.25
 

Attachments

  • Overnight2.png
    Overnight2.png
    131.1 KB · Views: 208
  • Overnight1.png
    Overnight1.png
    134.3 KB · Views: 146
Hello - Have had some family in town the past couple of days. So havent been able to post a recap. Will resume this evening.
 
08/21/15 Recap and prep (for 8/24).

Highest daily and weekly volume of the year, and largest range day of the year. Broke through several technical levels Friday, and out of the 25 week balance bracket.

Analyzing this on the profile I will admit, it a little difficult. It is this year that I've really incorporated it into my trading. This whole year has been range bound making analysis rather easy.

I do see that there is only two ticks of excess on the lows so this auction to the downside may not be over. On such a volatile day like Friday, several ticks of excess would be more re-assuring that the downward auction may be complete.
I have placed fibb retracements on the weekly and daily chart. Oddly, they both have a level at 1959 area to the downside.

The 1980 level has two single prints, if the mkt finds acceptance above this level I'll be looking for the POCs and halfback as potential targets to the upside at 1995.25
Lastly, on the daily chart the mkt has dug fairly deep below the 200 day MA. All of the above supports solid confirmation of a reordering of the markets thinking.
 

Attachments

  • Weekly.png
    Weekly.png
    43.7 KB · Views: 168
  • Daily.png
    Daily.png
    30.7 KB · Views: 134
  • Profile1.png
    Profile1.png
    82.2 KB · Views: 155
  • Profile2.png
    Profile2.png
    59.8 KB · Views: 126
08/24/15 Morning Update.

Vertical out of balance, and still probing for two sided trade. The nearest destination is to the downside. Which may be the Oct 2014 monthly low around the 1800 price level. I say level because different data feeds may have the low of Oct '14 different than others. However, the lock level down for the es is 1831 as of now.
The gap is not even worth mentioning nor the gap rules.
Volume is incredible for this time (0545am PST); 1,106,000.
O/N high is 1964.75
O/N low is 1892

0625 - es lock limit down 1870 hit.
 

Attachments

  • Overnight1.png
    Overnight1.png
    62.2 KB · Views: 156
  • Monthly.png
    Monthly.png
    51 KB · Views: 155
Last edited:
8/24/15 Recap and prep (for 8/25)
Incredible day goes without saying. 5.3M contracts in the ES alone. The profile is much too stretched out (120pts) to try and post.

Price made it all the way to test the Dec '14 monthly low at the 1947 level and did not find acceptance. Which was reached in F period. The rest of the afternoon session gave back all of the am session gains.

Not exactly sure what to make of the fact that the settle is exactly today's open; 1868.75

The 1800 level is still a possibility for the mkt to probe to. This level was made back in Oct '14.
 

Attachments

  • Monthly.png
    Monthly.png
    36.1 KB · Views: 175
08/25/15 Morning Update.

O/N Volume is high; 685K as of 0545am PST. Wide range overnight, 76 handles. Inside of yesterdays range; in balance. O/N inventory is 100% long.

Should we remain in balance today, there are several levels that may be targets. They are:
TPO POC 1917.25
Vol POC 1907
O/N halfback 1910
Monday's halfback 1890.75
CME Settle 1871.25

If we look above balance and accelerate the weekly low (from 2/06/15) 1958.50 is a level to pay attention to. Beyond that would be the gap close at 1968.

If we look below and accelerate, there is 30 handles of single prints to contend with.

O/N high 1948.5
O/N low 1871.75
Pit high 1950.75
Pit low 1831
 

Attachments

  • Overnight.png
    Overnight.png
    99.4 KB · Views: 192
8/25/15 Recap and prep (for 8/26)

Lower volume today w attempted direction being down usually implies a moderately strong mkt. But it's obvious there is still weakness across all the majors. All rallies were met with selling. However, value remained overlapping to higher.
Overall today was technically in balance to yesterday. That is the ruling reason for today's session.
Late afternoon saw a huge liquidation and left several ticks of excess on the lows. Jim Dalton always says, sometimes a market has to break before it can rally. The late day auction as far as the profile is concerned is complete. Doesn't mean the next one can't be another to the downside. I'll be keeping this in mind should tomorrow show some strength.

Still as of now, we are in balance on a daily basis, and out of balance to the downside on the intermediate timeframe.
 

Attachments

  • Profile2.png
    Profile2.png
    66.6 KB · Views: 146
  • Profile1.png
    Profile1.png
    61.3 KB · Views: 154
  • Daily.png
    Daily.png
    40.9 KB · Views: 136
  • Weekly.png
    Weekly.png
    35.9 KB · Views: 135
8/26/15 Morning Update.

Volume is lighter than yesterday yet still high: 620K at 0545am PST. O/N has wide range; 73 handles. O/N inventory is long but not 100%. Most of the activity has been on the bid side, steady. As of now we would be opening in balance relative to the past two days.
Balance rules should be applied:
1) Look above or below balance and fail; the opposite extreme becomes the destination in this case.
2) Look above or below and accelerate; which would initially target the prior pit levels / O/N levels. Beyond these levels on the upside would be the weekly low from 2/6/15 at 1958.50, then the gap fill at 1968. To the downside past the levels mentioned above would be the Oct '14 low; the 1800 area.

O/N high 1923.50
O/N low 1850.5
Prior pit high 1947.25
Prior pit low 1860
Settle 1873.75
I apologize for the graphics, I couldnt fit the whole profile into it.
 

Attachments

  • Overnight1.png
    Overnight1.png
    96.6 KB · Views: 149
  • Overnight2.png
    Overnight2.png
    86.9 KB · Views: 118
8/26/15 Recap and prep (for 8/27)

It appears to me that most of the morning the mkt was adjusting the long overnight inventory. Buyers were waiting in force near yesterday's settle. 41 contracts on the low which was 7 ticks above the settle.

When traders do not wait until a mechanical reference (mechanical references are levels such as O/N high and low, pit session high and low, 1/2 back, etc.) to step in, it is a sign of strength. Between these innovators, early adopters and the rest of the herd, they steamrolled the bears - and any other trapped shorts expecting more range extension to the downside.

Tomorrow may reveal whether the rally was purely short covering and/or new money buying. Short covering alone weakens a mkt as it removes buying power, and once complete, the mkt usually resumes the direction it was moving. If there was enough longer term new money entering the fray, then continuation is very likely.

Nonetheless, today was a balancing day as it was an inside day. On a daily chart the 3 day balance can be clearly seen.
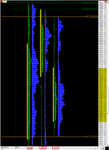
The profile graphic today is very reduced, I had to do this in order to fit the last 3 days. I want to show how value has been developing over the same. Viewing this confirms a mkt that it is in short term balance. Value areas are the gold bars to the left of the profiles
I post these recaps on my FB page as well.
https://www.facebook.com/pages/D%C3%B6bler-Derivatives-LLC/294362757431510
 

Attachments

  • Daily.png
    Daily.png
    34.2 KB · Views: 138
  • Profile1.png
    Profile1.png
    58.5 KB · Views: 159
082715 Morning Update.

Volume is getting back to normal and is moderate; 393K as of 0545am PST. Currently trading a 16 handle gap to the upside Gaps are measured from the prior pit highs/ lows. Gap rules are in play;
1) Go with all gaps that don’t fill right away. That means if it doesn’t back off early it’s probably not going to and is going higher. Large gaps may not fill or fill partially on the first day. pay attention to halfback: 1949.50
2) If the gap fills and value cannot get to at least overlapping, there will probably be a late day rally.

O/N high 1964.50
O/N low 1934.50
Prior pit high 1943
Prior pit low 1875.5
Settle 1936
 

Attachments

  • Overnight2.png
    Overnight2.png
    93.6 KB · Views: 197
  • Overnight1.png
    Overnight1.png
    86.8 KB · Views: 220
08/27/15 Recap and prep (for 8/28)

NOTE - this recap is long. I usually make an effort to keep them short. But there was alot of things in todays session that are very worth documenting as a recap and well worth the read.

Three very important concepts I want to cover in this recap. Nuances about the Market Profile. They are reliable and consistent.

--> First thing is, I was looking for a destination to be mindful of should the gap from 8/21 be closed today. The first one I noted on my chart was the 2 single prints in the 8/21 profile at 1981. These 2 single prints separate distributions in the profile and can be used as a target. The 2nd destination was the anomaly at 1986.25. Anomalies can also can be used as targets. The gap closed and the mkt spent 2.5 hours between these 2 levels and buyers struggled to push it any higher. What was working all morning wasn't anymore. That was, buyers buying every dip.
I also noted that the profile was very thin, indicating emotional, non-thinking buying. But with value migrating w price, it was difficult to determine what would unfold.

--> Second thing, long liquidation break. I track any breaks and/or rallies that happen in any period starting in J period. 64% of the time one or more of these events happen (115 sessions have been tracked). Aside from this metric, when buyers couldnt push price any higher after successfully buying every dip early on, and they spent 4 periods fighting w the bears, at the very least I knew it was real dangerous for anyone holding longs. The first indication was in I period when the 1 T.F. up had ceased. Once J opened and traded down w volume to support, the rout was on.

--> Third thing, referring to the gap rule that if the gap closes and value cannot get to overlapping, it increases the odds exponentially that a late day rally in the direction of the gap will ensue. Technically the gap was a handle shy of closing today's gap. But if you consider the prior 3 days as balance, combined that gap was closed. Value was nowhere near overlapping, and a violent rally followed. Incredible.

Top down:
Monthly: 1 T.F lower yet excess low forming. Balance and excess are the two most important concepts as far as the profile is concerned.
Weekly: 1 T.F lower yet excess low forming. Gap is closed.
Daily: 1 T.F higher out of balance (3 day) to the upside.

I apologize for the length of this recap. But these concepts played out today like a text book. I hope that at least one person reading this has picked up something to use in their own trading.
 

Attachments

  • WeekMonth.png
    WeekMonth.png
    53.4 KB · Views: 192
  • Daily.png
    Daily.png
    35.8 KB · Views: 211
  • Profile1.png
    Profile1.png
    138.8 KB · Views: 191
  • Profile2.png
    Profile2.png
    108.7 KB · Views: 210
  • Profile3.png
    Profile3.png
    119.5 KB · Views: 218
08/28/15 Morning Update.

Volume: 312K as of 0550am PST. O/N inventory is short but not 100%. Looks like we will be opening inside yesterday's range, and value area. Balance rules apply.
1) Look above or below and fail.
2) Look above or below and accelerate.
3) Remain within balance.

Should the mkt accelerate to the upside. A couple of targets could be the afternoon rally high from 8/21/15 at 2002.25 (which is an anomaly on the profile), and the single prints from the same profile at 2006.75

A couple to the downside could be 1956.25 which is the B period low from yesterday. This is where the buyers really stepped in and we had that upward march to 1986, also a high volume node. There is also the daily gap from yesterday that didnt close; 1943.

O/N high 1992.75
O/N low 1967.25
Prior pit high 1990.25
Prior pit low 1944.25
Settle 1989.5
 

Attachments

  • Overnight2.png
    Overnight2.png
    73.8 KB · Views: 143
  • Overnight1.png
    Overnight1.png
    73.7 KB · Views: 172
08/28/15 Recap and prep (for 9/31).

Volume today was substantially lower than the previous 7 sessions. 1.9M contracts and some change. Total rotational day with probes failing at both extremes on several occasions. Textbook day of balance. Very prominent TPO POC right in the middle of the profile. 12 wide out of a 14 TPO day. Not much else to comment on. 1 T.F. higher on a daily basis and the excess low on the weekly is confirmed. Next week should be interesting.
 

Attachments

  • Weekly.png
    Weekly.png
    28.6 KB · Views: 186
  • Daily.png
    Daily.png
    30 KB · Views: 172
  • Profile1.png
    Profile1.png
    83.6 KB · Views: 188
  • Profile2.png
    Profile2.png
    79 KB · Views: 126
Top