You are using an out of date browser. It may not display this or other websites correctly.
You should upgrade or use an alternative browser.
You should upgrade or use an alternative browser.
Making Money Trading
- Thread starter trader_dante
- Start date
- Watchers 334
- Status
- Not open for further replies.
lurkerlurker
Senior member
- Messages
- 2,482
- Likes
- 150
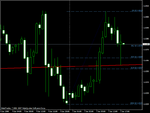
I think EUR/CHF maybe have some opportunity there, I am looking for long price action.
Daily chart.
Bullish hourly pin bar just formed if you are interested.
Edit - looks like you noticed it!
Bullish hourly pin bar just formed if you are interested.
Edit - looks like you noticed it!
yes, buddie, lets hope. :cheers:
lurkerlurker
Senior member
- Messages
- 2,482
- Likes
- 150
Hourly Pin bar shows up.😍
Looks like you have your trendline drawn in a few pips from mine! I'd like to take that setup. Pity about being on a break.
Looks like you have your trendline drawn in a few pips from mine! I'd like to take that setup. Pity about being on a break.
I'm already in, 10 pips now. First target 1.6465
trader_dante
Veteren member
- Messages
- 4,535
- Likes
- 1,704
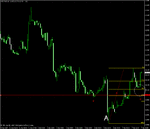
Example trade *Usd/Chf 1hr*
This is a good trade.
Pin bar forms at a minor s/r pivot on the 1hr which has confluence with the 50 fib of the last swing. (see circled area)
Note how the whole move started with a pin bar. (marked as A on the chart)
This is an excellent example of how to add to your position if you were long from the first pin.
Attachments
trader_dante
Veteren member
- Messages
- 4,535
- Likes
- 1,704
Trading worksheet for pin bar setups
For anyone that is interested I have made you an excel sheet that can help you identify the best pin bar setups.
When you are thinking of entering a trade based on a pin bar setup, fill in the sheet.
I have filled in the first line with the details of the Usd/Chf trade that was given as an example in the post above.
Explanation of sections:
After the date, market, TF and confirmation of pin bar boxes you have the boxes that DEFINE the pin bar.
If it is a PERFECT pin bar you should be able to say YES to all three of the questions that are asked.
When filling in the swing section, remember that the pin bar should be at a swing high or low. It should have had some momentum coming into it, it should not just drift down into an s/r level.
The S/R pivot level section is to show what levels the pin bar hits. Remember that the higher TF pivot that the market hits, the more likely it is to be significant.
The fib level section is to note which level it hits and on what TF. Ideally you are looking for areas where fib levels from different swings or on different TFs line up.
The EMA section is to see if the pin bar occurs at any EMA you regularly use. As noted earlier in the thread, I use the 10, 21 and 50.
Aside from the entry, the stop and the number of pips risked, I have put the 1st and 2nd problem areas. Each trader should get in the habit of filling these in as it is key to the preparation and planning of the trade.
Finally, always note your results. This will be very informative when you come back to look at your trades. Were your hourly trades more successful than your daily TF trades? Are you exiting trades too early compared to the risk in pips taken? Ad infinitum 😉
Feel free to add any other sections thats you think are neccessary.
Attachments
Last edited:
lurkerlurker
Senior member
- Messages
- 2,482
- Likes
- 150
For anyone that is interested I have made you an excel sheet that can help you identify the best pin bar setups.
Thanks TD. That is really useful. I can't give you more reputation without spreading some around first, but I would encourage others to. I'm going to fill this out for all my pin trades and post a copy with my equity curve at the end of each monthly review.
Nordtrader
Member
- Messages
- 62
- Likes
- 11
I have filled in the first line with the details of the Usd/Chf trade that was given as an example in the post above.
Hi TD,
Many thanks this great tool. Just wondering - in the USDCHF example you filled in, why did you say 'No' to Fib Confluence? I thought the pin coincided with the 50 fib?
Cheers,
NT
trader_dante
Veteren member
- Messages
- 4,535
- Likes
- 1,704
Hi TD,
Many thanks this great tool. Just wondering - in the USDCHF example you filled in, why did you say 'No' to Fib Confluence? I thought the pin coincided with the 50 fib?
Cheers,
NT
Hi Nordtrader,
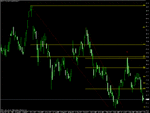
Fib confluence is where TWO different fib levels line up very close to one another.
Look at the attached example of US stock Caterpillar inc.
By drawing fib levels from both the previous swing highs, we see that the key levels of the 50 and the 61 line up almost on top of each other.
It is at this point that the market rally abruptly ends and the stock tanks.
Attachments
1Pipped
Well-known member
- Messages
- 273
- Likes
- 35
My usdcad (post 1265) trade got stopped out at break even while i was in the shower. Not a bad trade as it did turn around right on a possible support line I drew in, if I had been at the computer and it was a real trade not a demo, I might have pulled it out around there, but who knows ......... probably wouldnt as my worst habit is leaving positions on too long.
What did you think of that candle TD? I'll write what I think youll say, and then we can see if I have been paying attention ...
I think you'de say: It wasnt bouncing off the trend line I had drawn in properly, and that trend line may be useless now anyway as it has been broken before. Also there was the holy whole number (parity) where I had drawn a s/r pivot a bit too close below it.
I was using the trend line as a rough area, and I thought if it breaks through 1.0000 it'll probably go a fair way as there is bound to be lots of orders around there and people watching for a break.
Cheers !
trader_dante
Veteren member
- Messages
- 4,535
- Likes
- 1,704
My usdcad (post 1265) trade got stopped out at break even while i was in the shower. Not a bad trade as it did turn around right on a possible support line I drew in, if I had been at the computer and it was a real trade not a demo, I might have pulled it out around there, but who knows ......... probably wouldnt as my worst habit is leaving positions on too long.
What did you think of that candle TD? I'll write what I think youll say, and then we can see if I have been paying attention ...
I think you'de say: It wasnt bouncing off the trend line I had drawn in properly, and that trend line may be useless now anyway as it has been broken before. Also there was the holy whole number (parity) where I had drawn a s/r pivot a bit too close below it.
I was using the trend line as a rough area, and I thought if it breaks through 1.0000 it'll probably go a fair way as there is bound to be lots of orders around there and people watching for a break.
Cheers !
Hi 1Pipped,
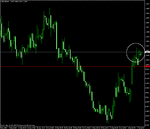
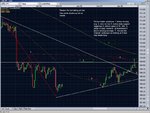
It was a beautiful looking pin. (see chart 1) Absolutely picture perfect but ultimately was a bit of a gamble in terms of the setup.
The main problem for me is that, as you said, you were shorting straight into a strong s/r pivot which had round number confluence. (see chart 2)
Attachments
shadowninja
Legendary member
- Messages
- 5,524
- Likes
- 645
probably wouldnt as my worst habit is leaving positions on too long.
Try this:
When you're 15-20pips in profit, close 2/3 of your position. Move the stop to breakeven. Let the remaining 1/3 play out. It'll either go on to earn you another 50 pips or reverse to return 0pips. In any case, you've gained 15-20 pips minimum. Experiment and see how it goes for you.
trader_dante
Veteren member
- Messages
- 4,535
- Likes
- 1,704
Try this:
When you're 15-20pips in profit, close 2/3 of your position. Move the stop to breakeven. Let the remaining 1/3 play out. It'll either go on to earn you another 50 pips or reverse to return 0pips. In any case, you've gained 15-20 pips minimum. Experiment and see how it goes for you.
Good post shadowninja.
I don't do that but every trader should find out what works for them. Experimentation is KEY!
Adjust the figures accordingly though...15-20 pips profit is way too early for a daily bar...
Tom
Nordtrader
Member
- Messages
- 62
- Likes
- 11
Hi Nordtrader,
Fib confluence is where TWO different fib levels line up very close to one another.
Look at the attached example of US stock Caterpillar inc.
By drawing fib levels from both the previous swing highs, we see that the key levels of the 50 and the 61 line up almost on top of each other.
It is at this point that the market rally abruptly ends and the stock tanks.
Thanks for clearing that up, makes sense now.
Cheers,
NT
shadowninja
Legendary member
- Messages
- 5,524
- Likes
- 645
Adjust the figures accordingly though...15-20 pips profit is way too early for a daily bar...
Good point. In that case it should be when the trader thinks "Hmm, I should close my position now because it's going to go against me." and not because everything says it is going to change (including price action) but simply because the trader is nervous. Close most of the position and leave a little bit open. I did that earlier this year and gained an extra 200 pips!!
Last edited:
1Pipped
Well-known member
- Messages
- 273
- Likes
- 35
Thanks for the reply TD, I appreciate it, good to know I was thinking about the right sort of things.
And thanks for that shadowninja, force myself to close some of the position earlier than I normally would, I can easily do that now on any size trade at oanda so Ive no excuse for not at least trying that!
And thanks for that shadowninja, force myself to close some of the position earlier than I normally would, I can easily do that now on any size trade at oanda so Ive no excuse for not at least trying that!
Good point. In that case it should be when the trader thinks "Hmm, I should close my position now because it's going to go against me." and not because everything says it is going to change (including price action) but simply because the trader is nervous. Close most of the position and leave a little bit open. I did that earlier this year and gained an extra 200 pips!!
What do you do when the price against you?
drspartacus
Newbie
- Messages
- 7
- Likes
- 3
shadowninja
Legendary member
- Messages
- 5,524
- Likes
- 645
What do you do when the price against you?
Just hold and hope that it reverses. It's not a loss until you close the position.
Only kidding. 😆
Get stopped out at stops define by trader_dante's system.
- Status
- Not open for further replies.
Similar threads
- Replies
- 3
- Views
- 2K

