Making Money Trading

Which market do you want to learn to trade?


  • Total voters
    101
  • Poll closed .
Status
Not open for further replies.
I see a wide ranging bar with a bearish close. I certainly wouldn't have been thinking of going long...

I answered you, doesn't seem to have gone through.

Thanks for the reply.

I shorted the 1000 pin. Took advantage of pullback on 1100. Stop at 6375. My 23.6% Fib line is 6267.7.

Split
 
Andy's turned his pm off, but he can't fool me! He won't be able to stay away three days. I bet he's nosing his way around these posts as I write.:LOL:

Split
 
Hi Tom,

Could you share some update majors currency's r/s level on daily chart, thanks.

Qiu
 
Last edited:
4hr USDCAD

As I type price has gone straight through the line I have drawn at 1.000 I only did this on a demo because I have just changed brokers (to oanda) and am not used to their platform yet, doh! looked a good trade though.
 

Attachments

  • usdcad.gif
    usdcad.gif
    15 KB · Views: 543
TD....good afternoon.

May I ask..is that a pin bar on the Light Crude one minute chart? (A couple of minutes ago)

TIA
 
TD....good afternoon.

May I ask..is that a pin bar on the Light Crude one minute chart? (A couple of minutes ago)

TIA

Please read the thread before posting. TD does not discuss pin bars on the 1m time frame. The 1m chart is a little arbitrary to be concentrating on a reversal which happened within a minute. Try 65 second or 55 second charts and you'll see different "pins".

Pin bars are defined on this thread along with some pretty helpful charts. If you go back over the thread and still don't understand what a pin bar is, feel free to ask.
 
Sorry Lurker. Didn't mean to offend. I realised that he does not trade off the 1m chart...but what I meant was...is that what one should look like? (I've read the thread but of course, since I am learning...am not confident in being sure what one looks like). If you see what I mean?

Sorry again.
 
Please read the thread before posting. TD does not discuss pin bars on the 1m time frame. The 1m chart is a little arbitrary to be concentrating on a reversal which happened within a minute. Try 65 second or 55 second charts and you'll see different "pins".

Pin bars are defined on this thread along with some pretty helpful charts. If you go back over the thread and still don't understand what a pin bar is, feel free to ask.

With due respect, "Please read the thread before posting" is no mean feat you are asking. I managed to recup. up to page 35 yesterday. Something will have to be done to make this most useful thread readable. A pity to let it go unedited the way it is.


TD--- I'm out of this at break even. Will try again tomorrow!

Split
 
Last edited:
Sorry Lurker. Didn't mean to offend. I realised that he does not trade off the 1m chart...but what I meant was...is that what one should look like? (I've read the thread but of course, since I am learning...am not confident in being sure what one looks like). If you see what I mean?

Sorry again.

No need to apologise - I'm sorry if my post seemed brusque - however, I'm sure there are some good charts on this thread which show what a pin bar is. Here is one I called recently on the G/Y.

Feel free just to browse the thread and look at the charts. I've just asked TD for a good definition of a pin bar for a thread I have on these boards, so hopefully he shall oblige and we will both be happy.

Sorry if my post offended you.
 

Attachments

  • GBPJPY_D.png
    GBPJPY_D.png
    16.8 KB · Views: 517
Thanks Lurker (no of course I was not offended :) ). That does help. I have looked at the charts over and over again (even saved this thread as a PDF but there is just so much noise, that I can't seem to get a definite enough picture in my mind...ie. one that would make me confident enough to spot one myself. So would appreciate if TD could give a good def for your FX thread.

Once again thanks for that chart.
 
Sorry Lurker. Didn't mean to offend. I realised that he does not trade off the 1m chart...but what I meant was...is that what one should look like? (I've read the thread but of course, since I am learning...am not confident in being sure what one looks like). If you see what I mean?

Sorry again.

It is a pin but I like to see the close within the range of the previous bar.

Be very careful on this TF. You will see pin bars everywhere. Although I believe price action setups can be played on any TF you have to be incredibly discerning on the lower TFs and I think trading the 1m, 3m, 5m TFs is the reason why most new traders fail.

Tom
 

Attachments

  • crude_1m.jpg
    crude_1m.jpg
    110.5 KB · Views: 727
Last edited:
Thanks Lurker (no of course I was not offended :) ). That does help. I have looked at the charts over and over again (even saved this thread as a PDF but there is just so much noise, that I can't seem to get a definite enough picture in my mind...ie. one that would make me confident enough to spot one myself. So would appreciate if TD could give a good def for your FX thread.

Once again thanks for that chart.

Hi darshybaby,
TD give some very clear demonstratings about how to plan and operate a trade.

Here is one of them
http://www.trade2win.com/boards/first-steps/26947-making-money-trading-81.html#post373220

you can search all TD's post, and read them.

I have to say, very clear, very logical.
 
E/U, G/U, A/U, U/CAD :cheesy:

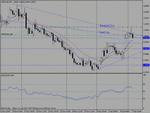
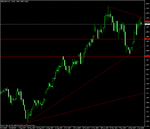
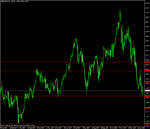
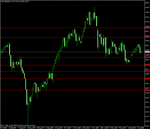
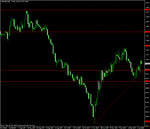
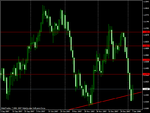
As requested.

Please note that the reasons for many of the levels are not obvious from the chart itself as they are the result of data that cannot be seen on them.

Please also realise that they are not neccessarily correct, they are just the way I see the market.

Feel free to analyse the market yourself and see if you agree but I honestly would not trade blindly off these levels. Although they all appear on the chart, some of them are stronger to me than others.

Chart 1: Eur/Usd
Chart 2: Gbp/Usd
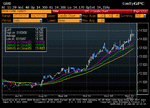
Chart 3: Aus/Usd
Chart 4: Usd/Cad
 

Attachments

  • eur1.gif
    eur1.gif
    18 KB · Views: 826
  • gbp1.gif
    gbp1.gif
    22 KB · Views: 749
  • aus1.gif
    aus1.gif
    17.5 KB · Views: 674
  • usd2.gif
    usd2.gif
    17.1 KB · Views: 672
As requested.

Please note that the reasons for many of the levels are not obvious from the chart itself as they are the result of data that cannot be seen on them.

Please also realise that they are not neccessarily correct, they are just the way I see the market.

Feel free to analyse the market yourself and see if you agree but I honestly would not trade blindly off these levels. Although they all appear on the chart, some of them are stronger to me than others.

Chart 1: Eur/Usd
Chart 2: Gbp/Usd
Chart 3: Aus/Usd
Chart 4: Usd/Cad

Thanks a lot, I will fish there :clap:
 
Hi TD,

Please see attached graph.
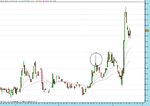
I dont know if others also find this but I often see pinbars during a normal price climb / falls (see attached). This is a daily candle chart. Can you talk me thru what you would read from it.
Thanks.
ps. My main point is that you get an inverted pinbar on an uptrend that the price just sails past without even a blink.
 

Attachments

  • graph.GIF
    graph.GIF
    30.3 KB · Views: 582
Hi TD,

Please see attached graph.
I dont know if others also find this but I often see pinbars during a normal price climb / falls (see attached). This is a daily candle chart. Can you talk me thru what you would read from it.
Thanks.
ps. My main point is that you get an inverted pinbar on an uptrend that the price just sails past without even a blink.

A daily candle chart of what? I can't get enough information from your chart as it's too small.
 
I think EUR/CHF maybe have some opportunity there, I am looking for long price action.

Daily chart.
 

Attachments

  • eurchf.PNG
    eurchf.PNG
    27.7 KB · Views: 490
Status
Not open for further replies.
Top