Making Money Trading

Which market do you want to learn to trade?


  • Total voters
    101
  • Poll closed .
Status
Not open for further replies.
As you don't mention the only 3 authors of whom any notice should be taken whatsoever, Dr. Alexander Elder, Daryl Guppy and John Murphy, I can only conclude, along with your continual postponement of anything concrete or of substance, that You Sir are a Charlatan. or in other words, enough already, post something of value or get off the pot.

We usually agree, but on this particular occasion I'd have to say none of the authors you mentioned have contributed to enlightening my insights in the market. I'm not saying they were a bad read, but the true Aha-Erlebnis sure didn't came from them... but each to his own 🙂
 
The only thing I would suggest dante, if you permit, is that you remove that line from your signature. It's absolutely not needed to support your claims, it only makes you look like you are trying to sell something.

Accepted and done.

It's 2.45am Sunday morning and I can't sleep for thinking about the best way to convey everything to you all...

I really hope I do this method justice.

If anyone has any questions or doesn't understand anything as we progress, please, please ask. If you are afraid to ask infront of everyone, then PM me.

T_D, consider if you will that this thread is in the First Steps Forum and that this is where newbies ought to ask their questions...saves going over and over the same issues time after time.

Also consider that they can only be spoon fed to a certain level, but as we know, at some point they surely must do the work in order that they may benefit from the teachings.

tx cv
 
I'd say a good imagination. But you won't believe me because you are a rookie. There are no shortcuts. OK? But you still won't be able to keep away from this thread. It has been very interesting to see who has expressed an interest in it. Hard to determine whether it is genuine or not....can't be genuine....surely....😆

Beg to differ... you don't need imagination to come up with 2,164% in 15 weeks time.
All you need is a simple calculation 😛

This leads you to an average of 4.185% a day (15 weeks being 75 trading days). If you read trader_dante's posts carefully, you'll notice he has a slightly higher than normal tendency towards risk-tolerance. I don't know what the maximum position is that he would allocate to any single trade, but his largest single drawdown was almost 10% (rather big).

So if you take a rather big risk on each trade, but are confident in your trades and have a high win ratio (which is around 80% according to dante), then it's perfectly seizable to average 4% a day.
 
I would like you all to think of the first example I posted above (FTSE 100) as like a finished puzzle.

The pieces that make up this puzzle are:

The price action (the pin bar) ,
The fibonacci level
The support/resistance area

These pieces come together to create a high probability setup.

Any of these pieces could have been played on their own but I personally want to see confluence when I trade.

Confluence is simply a joining of elements. In the above example, the fib level and the support/resistance area came together to give that level importance. When the price reacted to it we gain even more confidence in the trade.
 
Accepted and done.

It's 2.45am Sunday morning and I can't sleep for thinking about the best way to convey everything to you all...

I really hope I do this method justice.

If anyone has any questions or doesn't understand anything as we progress, please, please ask. If you are afraid to ask infront of everyone, then PM me.

I got home early from a night out and as we are changing hours this night (daylight savings time) I found myself an extra hour 🙂 . Was only going to check T2W for 5 minutes, but then I stumbled upon this thread...
 
I will certainly share my methods regarding exits. I think exits are even more important than entries and they are an area that I want to devote most of my attention too.

Been saying that all along. One fantastic exit can cover 10 miserable entries...
 
I would like you all to think of the first example I posted above (FTSE 100) as like a finished puzzle.

The pieces that make up this puzzle are:

The price action (the pin bar) ,
The fibonacci level
The support/resistance area

These pieces come together to create a high probability setup.

Any of these pieces could have been played on their own but I personally want to see confluence when I trade.

Confluence is simply a joining of elements. In the above example, the fib level and the support/resistance area came together to give that level importance. When the price reacted to it we gain even more confidence in the trade.

I suspect most readers won't have a problem with identifying a Fibonacci level nor with seeing a pin bar. However, identifying support & resistances zones might be a whole different matter, which is why no matter how hard you try to describe your system, other traders might still see something different than you. Which isn't necessarily a bad thing.
 
Been saying that all along. One fantastic exit can cover 10 miserable entries...

Actually, your entries and exits thread was very very informative. The exits thing has been bothering me regarding trading on a daily timeframe. What constitutes noise on a daily time frame, and what signals that the direction is changing or that the entry was wrong?

Look at trader_dante's reputation points - he has added an extra 3 green dots today!
 
As one clever observer has already pointed out, my FTSE chart does not look the same as his! Principally, he has no pin bar but a bullish bar instead!

The reason for the discrepancy is the SB broker I use has a unique way of dealing with gaps.

If a gap up/down occurs in price, rather than simply open the market at the new level leaving a visible gap on the chart, it will "fill" the price in on the chart.

So in this case, when the market gapped down after the weekend, rather than a chart showing a lower open (a gap) followed by a move up (to fill the gap)- my broker shows a large bar down that then retraces.

I hope this is not too confusing and I thought I would just let this one ride rather than delete it and post another example.

Many people will get slightly different looking price action from time to time. I have come across this frequently in the FX market. If you have a US and a UK based broker that operates their charting in their respective timeframes you may find that because of the international time difference, the UK end-of-day (EOD) bars are printing five hours earlier, creating sometimes very different setups.

I have always been taught to play these bars as you see them - your charting package is after all only a window to view price action through.

If you didn't have a pin bar in your FTSE chart, you could have still entered a high probability trade by trading "the gap". This is a technique whereby a trader will enter the market in expectation of a gap in price being filled. The confluence I illustrated above would have given you two supporting reasons to enter this trade long. I personally do not trade gaps so I won't talk about it further here but I know other traders who say that trading the weekend gap on some of the FX pairs is among the easiest money they make.

I like what you're doing here.

I would suggest one correction to what you have been taught. You were taught: "I have always been taught to play these bars as you see them - your charting package is after all only a window to view price action through."

I would suggest that its better to try to figure out how the other players in the market see the world and then make sure that you can perceive what they perceive. My rational is that the confluence of support/res fibs and price action (and/or mas) is really you, the trader, looking for situations where as many players as possibly perceive your scenario as a good setup or will do so in a short time as their patterns fill in.

So, FWIW, I attempt to look at the market thru the same lenses as big players, active traders, and other major influences. I try to look at their preferred timeframes; their preferred tools; and think "what will they see now?"

Which brings me to my only criticism of your generous thread: if a two bit (sorry but you did say a spreadbetting) company shows the market differently to the way that the major influences see it then you need to get different charting. 😉

All the best.
 
The puzzle pieces

When I am sitting on the sidelines watching the market, it is important to me to be able to see the potential pivot areas that price might turn at.

The price action is the turning point itself and as a result of this, it is the final piece that you slot into the puzzle.

I will soon talk about price action (and principally pin bars which are the foundation of my strategy) but before we look at them, I want to show you how I initially approach the market before attempting to trade it.

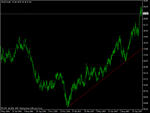
I am going to use Crude Oil as an example. Let's assume I have just logged onto my broker and opened a clean chart for this market on the daily timeframe.
 

Attachments

  • oil_1.gif
    oil_1.gif
    10.6 KB · Views: 7,007
Support and resistance zones - still something I have a problem with. Firewalker, do you use volume bars (ie X cards per bar) to establish S/R levels? Have you considered paying attention to volume around key S/R points, and how do you go about this?

T_D - just so we are all on the same page when you show us some of your setups, could you show us how you draw support and resistance lines?

Hi Lurker, not my place here to tell you what I do or don't. This thread is about t_d, not about somebody else's system or rules, let alone mine.

But for the record, yes I do take into account volume and I posted dozens of charts with annotations and comments in the DOW 2007 thread (the When to Sell thread, the Tape Reading thread, The S/R: Mirror of Erised thread, etc...) where I explained what I saw and why I saw that. If you have any questions surrounding those, feel free to ask them in the respective threads.

I'll leave it up to t_d to answer your other question.
 
About the journey as a trader

The second reason is slightly more egotistical. It has taken me seven years to find my way in this game. And now I am having success, I want to tell everyone about it. I will tell you now I've had many detractors in my life. Colleagues, friends, sometimes even close family that have told me I will never make it. To stop trading - to stop gambling and to pursue a "worthwhile career". This is my way of showing that I am making it and that I can help others make it too. Perhaps the irony of all this is that the people I want to prove myself the most too, will never see this.

Although the following can be about anything you want, for me it very accurately describes the trader's journey. I don't mean to distract you any further, but reading the above and knowing all to well what this game can do to a person, I hope you don't mind me posting this...:


and then it all
opened before me
like a great and brilliant
light
and all was before me
as it seemed
that i could go anywhere
and as i looked down
both of the roads
i chose once again
to take the one
not traveled
for the road was exciting
and unfounded
and mysterious
and i being once afraid
looked down the road
with great determination
and joy
for i determined the path
that this road would follow
this one, not traveled by many
and the view
is spectacular
there are no road signs
no paved paths
there are no cut away trees
it's simply lovely,
and is just as it was before
except now, i travel it
and stop and marvel
and get tangled in it's mess
and admire it's beauty
for it is a road that i have
chosen
and for the first time
my eyes see it
for all the beauty that is
with in it.
and still, and ever so much
glad that i took this road
less traveled by.
it will make
and has made
all the difference

 
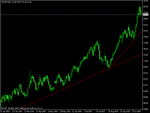
The first thing that stands out to me is the clear trend up so I draw in a trend line. I am not worried about getting the drawing of this line perfect. I don't spend ages wondering whether I have connected the right lows. I just want to get an idea of where that TL support will be coming in.
 

Attachments

  • oil_2.gif
    oil_2.gif
    11.2 KB · Views: 6,855
Secondly, I look for other possible trend lines. The one I have drawn on the chart is, in my opinion, not valid yet.

It is generally accepted that a TL needs three touches to be valid. I subscribe to that rule.

In this case, I am drawing it on the chart because it connects the most recent swing lows and I want to see if the market will react to it at a later stage.
 

Attachments

  • oil_3.gif
    oil_3.gif
    11.7 KB · Views: 6,529
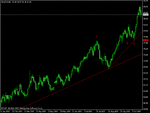
Next I want to identify areas of support/resistance.

Now this is a KEY part of my strategy. Everyone draws S/R differently. I will show you the way that I have found works for me.

What I am looking for is obvious pivot areas where previous resistance has now become support and vice versa.

These should stand out as clear as day when you get used to looking for them.

Here is the first one that draws my eye.
 

Attachments

  • oil_4.gif
    oil_4.gif
    11.9 KB · Views: 7,758
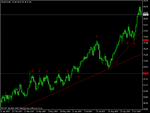
Here is another area. This was significant resistance for several months before a breakout occured and the market then tested it and the level became support.

This area stands out very clearly to me.

When you look at these charts, you will often find minor areas of support and resistance. I tend to ignore these. You want to find the areas that the major players are going to be looking at. It is these major levels that the price has a high probability of reacting to in the future.
 

Attachments

  • oil_5.gif
    oil_5.gif
    12.2 KB · Views: 6,959
Here is the other level that stands out to me (the middle line of the three horizontal)

It is not as immediately clear as the other two but it stands out to me nonetheless.
 

Attachments

  • oil_6.gif
    oil_6.gif
    12.3 KB · Views: 7,110
The final touch I have to make to this timeframe is to add in a level that hasn't been tested yet but which I think may be. This is the top red line in this chart and I have drawn it there because it joins the two recent highs that price broke out of.

So this is what my chart will look like when the market opens.

Rather than try and jump into the market mid-move, I wait for it come to my levels and see if it reacts to them in a way that will give me a high probability setup for entering the market.
 

Attachments

  • oil_latest.gif
    oil_latest.gif
    11.6 KB · Views: 8,163
Last edited:
Pin bars

Pin bars are the price action setup I look for at my pre-drawn pivots.

The pin bar is an abbreviation of Pinocchio bar. It was coined by Martin Pring. The reason it is called Pinocchio bar is because it is based on the old European story about the wooden boy, Pinocchio whose nose grew longer the more he lied.

Pin bars lie to you about the direction the market is going in. When we see a pin bar we can take a trade in the opposite direction to one in which the nose is pointing.

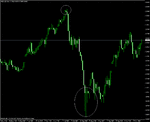
Pin bars can occur at market tops. And market bottoms. Once you start looking for them you will see them everywhere. These ones I have circled stand out because our eye is naturally drawn to the highs and lows on a chart. They would have resulted in massive wins.
 

Attachments

  • nzd.gif
    nzd.gif
    19.2 KB · Views: 8,510
Last edited:
Status
Not open for further replies.
Back
Top