Making Money Trading

Which market do you want to learn to trade?


  • Total voters
    101
  • Poll closed .
Status
Not open for further replies.
Couldn't have said it better myself

I would suggest that its better to try to figure out how the other players in the market see the world and then make sure that you can perceive what they perceive. My rational is that the confluence of support/res fibs and price action (and/or mas) is really you, the trader, looking for situations where as many players as possibly perceive your scenario as a good setup or will do so in a short time as their patterns fill in.

So, FWIW, I attempt to look at the market thru the same lenses as big players, active traders, and other major influences. I try to look at their preferred timeframes; their preferred tools; and think "what will they see now?"

Spot on. This is an incredible post.
 
Eur/usd

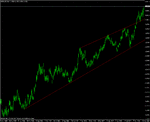
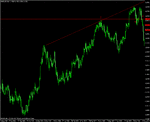
Have a look at the following chart of the EUR/USD. Look at the lower ascending TL. If you had drawn that in (back when it had only touched twice) you would probably have sat up and took note when it came back to it in August.
 

Attachments

  • eur.gif
    eur.gif
    17.1 KB · Views: 7,742
Last edited:
This is another A grade setup.

Price pulls back to the ascending TL and forms a pin bar.

Price had retraced a little deeper than any fib level from the last swing low but if you draw fibs from the two prior swing lows you will see that the 61 of the first and the 50 of the second are literally on top of one another. And the nose of the pin bar touches them.

This is confluence. And it is very powerful. Other traders are watching these levels and the pin bar is a heads up on what they are doing.

The psychology behind the pin bar is simple: in this case, price fell and then was met by significant buying support which caused a rapid reversal and a close near the highs.

This validates your pre-drawn lines.

Whenever I see a pin that touches a pre-drawn line almost to the very pip, I get strong confidence in the trade. Why shouldn't I? I have analysed the market and drawn on a pivot and the market has shown me that at least temporarily, I have been proved right. Once the pin is then triggered it means price is still going in my favour.

This is an important part of gaining confidence in your trade.
 

Attachments

  • eur1.gif
    eur1.gif
    22.6 KB · Views: 8,593
As traders there is only one thing we can control in this market and that is our risk.

There are two elements to risk. There is the initial element where you decide on your position size. Once you decide on your position size and take your position you are in charge of managing your risk as it changes with the market movement.

Drawing on your levels before you enter the market is the KEY to managing this risk and being in control.

Being aware of key levels in the market is my way of knowing where it may be the best place to tighten my stop or to look to take profit. It will also tell you where to safely put your stop so that you do not get shaken out of a large trending move.

Don't be caught unaware by the market. React to it.

Drawing these levels is part of planning your trade.

Plan your trade and trade your plan.
 
Let's imagine we were going to take this pin live now.

I would go through the chart and mark all the areas where I think price may stall or run into difficulty.

Obviously we are looking to be filled in a long position (when the market breaks the high of the pin) so the areas we are trying to pinpoint are going to be overhead.

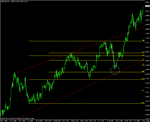
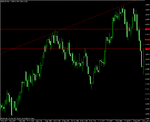
Here is the first one based on previous support/resistance areas.

Again remember - look for the most obvious.
 

Attachments

  • eur2.gif
    eur2.gif
    20.5 KB · Views: 8,017
Last edited:
Here is a possible second.

Drawing these is more of an art than a science. Look for areas where the price was rejected and areas where it bounced.

The reason this particular S/R level was drawn here was that I am favouring the large bounce (far right arrow). This to me was a strong support and since we know these levels flip, has a fair chance of becoming future resistance. It also coincides with two large rejections (far left two arrows).

+++++++++++++++++++++++++

A WORD ON THESE CHARTS: When you open them, you may need to hover over the bottom right corner and click on the enlarge icon. Some of the lines do not appear when Internet Explorer resizes the image to fit in the browser window.

+++++++++++++++++++++++++
 

Attachments

  • eur3.gif
    eur3.gif
    20.5 KB · Views: 7,630
Last edited:
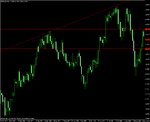
Final level I would draw for now (at least until the move gets underway if it does at all) is this top one.

The trader is now prepared to take action if price confirms that any of these lines are correct.
 

Attachments

  • eur4.gif
    eur4.gif
    20.6 KB · Views: 6,925
Last edited:
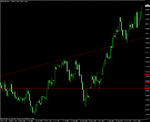
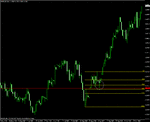
Now lets presume we took this trade long.

First thing you see is that price hits our pre-drawn line and retreats.

That resistance (which in all fairness we would have expected) could have been used to take profit for a risk/reward of around 1:1 OR it could simply have served as a warning sign to tighten your stop to break even which should be just past the high of that pin.

But if you are very confident you could keep your stop where it is. Something I have found in my experience is that when price breaks a pin bar higher/lower, it will often retrace to the breakout point before continuing on. If you are too quick to get your stop to BE you could end up being shaken out.
 

Attachments

  • eur5.gif
    eur5.gif
    20.5 KB · Views: 6,857
Last edited:
We usually agree, but on this particular occasion I'd have to say none of the authors you mentioned have contributed to enlightening my insights in the market. I'm not saying they were a bad read, but the true Aha-Erlebnis sure didn't came from them... but each to his own 🙂

fair comment as always
 
In this example, if you had moved your stop to break even, you would most likely just be hanging onto this trade. Sometimes you will get stopped out and price will move on higher without you.

Believe me, I know how frustrating this can be but never chase the market. If you are shaken out of a trade and the market moves off, wait for another optimal place to get on board.

There should be a good and clear reason for entering any trade. This should be at a turning point - what I refer to as a pivot point. A very good reason for this is that it allows for a clear idea of where to place your stop.

So, back to our example. Let's assume we are still in this trade.

Price responds well, moves up through the second resistance in one sharp move and then stalls at the third.

Again this could be a chance to take profit or time to tighten your stop.

As I trade these setups live, I will show you what I do. I play these somewhat instinctually in terms of exits and this comes from my experience.
 

Attachments

  • eur6.gif
    eur6.gif
    20.5 KB · Views: 6,928
Last edited:
Look closely at this chart. Many traders would be shaken out of this trade if they didn't take profit at that third level on the chart.

When we look at a chart like this we see a consolidation before the next leg higher and it looks rather easy, with the benefit of hindsight, to say we would have placed a stop BELOW the inital S/R break and then held the trade through this period of consolidation.

In reality, many market players would be stopped out as the market fell around 150 pips and for many of us, that is too much profit to give back to the market.

It is hard to say what I would have done since I wasn't in this but looking at the chart I think the correct thing to do would have been to trail the stop to just beneath the second support, so in this case we would be also out.

If we had been stopped out we would have been frustrated to see the market go straight back up and test the highs of the consolidation zone BUT, this chart perfectly illustrates why this shouldn't bother you. You never know what the market is about to or what it is about to offer you.

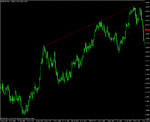
Soon after, the market comes back for a final test of our initial S/R levels and forms another pin bar. This S/R level has confluence with the 50 fib from the swing low to the consolidation high.

This pin made another excellent entry into the trend.
 

Attachments

  • eur7.gif
    eur7.gif
    17.9 KB · Views: 6,746
  • eur.gif
    eur.gif
    18.9 KB · Views: 6,489
Last edited:
Well there is a lot of reading for you all to do. I hope I have explained things clearly enough. These are just the very basics of my methodology. The really good stuff will start soon. I am off to bed now as its 6am. I may not be around much tomorrow 😉
 
If you had kept your stop below the last support, you would have still been in this trade when it formed another pin bar and then took off. If you had been taken out after the repeated failed breakout attempts at our top level, this pin made another excellent entry at prior resistance and new support.

Tom, great stuff so far 😀

just as an aside, in addition to the SR and Fibs levels, do you ever take a look at Speed Lines ? (for newbies, they're like a lazyman's Fib levels) ?
As you can see from attached, the speed lines supported all your calls at the time. there's even an extra one which I didn't draw on for sake of clarity, from the low on 5 Mar to high on 25 april, which shows confluence (where R turned into S) exactly at 13830 on 18 sept, the next opportunity to go Long for those who'd missed earlier opportunities, or to add to existing positions.

don't want to go off tangent or take anything away from your fine thread, just thought I'd mention it as our trading styles are so very similar and I find these useful as a quick and dirty method (and as my wife can attest, i like quick & dirty 😈 )

Garry
 

Attachments

perhaps I was unduly harsh in my earlier criticism of DT, but even he later acknowledged that he needed to get the ball rolling. My comments were backed up or similar to those made by other well-experienced, proven members of these boards.
Funny then that the people who described our various constructive criticisms as "cynical", "moronic", "idiots", "unsuccessful" etc were all Newbies with scarcely 20 posts between them.
Considering that we'd been chivvying DT along in order to start to deliver something worthwhile and of benefit for you new guys, i don't think you've made a very helpful intro of yourselves to these boards.

Garry

Oh well it's all water under the bridge now...
 
Tom, great stuff so far 😀

just as an aside, in addition to the SR and Fibs levels, do you ever take a look at Speed Lines ? (for newbies, they're like a lazyman's Fib levels) ?
As you can see from attached, the speed lines supported all your calls at the time. there's even an extra one which I didn't draw on for sake of clarity, from the low on 5 Mar to high on 25 april, which shows confluence (where R turned into S) exactly at 13830 on 18 sept, the next opportunity to go Long for those who'd missed earlier opportunities, or to add to existing positions.

don't want to go off tangent or take anything away from your fine thread, just thought I'd mention it as our trading styles are so very similar and I find these useful as a quick and dirty method (and as my wife can attest, i like quick & dirty 😈 )

Garry

LOL

Don't worry about going off on tangent. Any contributions are MOST welcome. I have never used speed lines but I will take a look at them.

I try and keep things simple and just play price action off key fib levels and S/R zones.

There are many other things you can add to your charts to look for confluence. Some people use calculated pivot points. Others use particular moving averages like the 200.
 
Pin bars are the price action setup I look for at my pre-drawn pivots.

The pin bar is an abbreviation of Pinocchio bar. It was coined by Martin Pring. The reason it is called Pinocchio bar is because it is based on the old European story about the wooden boy, Pinocchio whose nose grew longer the more he lied.

Pin bars lie to you about the direction the market is going in. When we see a pin bar we can take a trade in the opposite direction to one in which the nose is pointing.

Pin bars can occur at market tops. And market bottoms. Once you start looking for them you will see them everywhere. These ones I have circled stand out because our eye is naturally drawn to the highs and lows on a chart. They would have resulted in massive wins.

A very informative post. One small criticism:
"Once you start looking for them you will see them everywhere".

This however will lead new aspiring traders to take setups all the time. Pinbars on a 1-minute time frame? Sure... Plenty!

It's my experience that the higher the timeframe the more reliable a pin-bar and the more powerful the signal.

But as you know where to look for pinbars, you already know which ones are the high probability ones 😉
 
A word on timeframes

Read Firewalkers post above

Boy am I glad you guys are here helping me🙂

If you are new to this, forget about the lower timeframes. The higher the timeframe the more reliable the signal.

The only two timeframes I use are daily and hourly.

These two timeframes allow me to trade whilst in the constraints of a 9-5 office job.

You don't need to give up work and be a day trader to make a lot of money in the market.

I know traders that trade only daily bars and they do very well. They concentrate on FX majors and once they have drawn their levels in, they may only "work" for a few minutes a night as they scan the charts for price action and place any corresponding orders. This is the great secret in trading - the holy grail if you like: You do not have to go through hell and give up your life to make money. There is no need to spend hours poring over charts or assessing fundamentals. Price action works. You can make money trading it.

I am lucky in that I can access my charts at work and look at them frequently.

I set my charts up as follows:

1. I will go through and mark all the areas of S/R as I have shown you on the daily TF. I will drawn in any trendlines too. I sometimes draw in the fib levels before hand but sometimes put them in only if I see price action otherwise the chart can end up looking like some kind of nightmare.

2. I go onto the hourly TF and I mark off the S/R levels that I see on that.

I will give you an example in due course but remember: only draw in the significant levels. If you draw in every minor S/R pivot you are going to likely end up with a whole lot of lines that are very close together and little confidence to trade because of fear that the market has nowhere to move before it runs into another line.

Once I have done this, I then pull up the charts every hour and look to see if price is reacting to any of my pre-drawn lines. I then look what is happening just before/after the close of the session.

That means for commodities, I usually have a look at what price action is on the daily TF at around 7.30pm. I scan the bonds/interest rates and the indices at 9.15pm and I scan all the FX pairs at Midnight. All times are GMT.
 
Last edited:
AUD/CAD

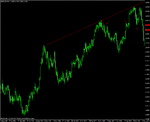
Sometimes when you look through a chart you will see a setup that although shows no price action setup (in terms of a specific bar) on the day you look at it, it nonetheless looks very interesting.

Once I see one it goes straight into my portfolio. It may develop daily price action or it may post hourly price action.

My job as a trader is to find the optimal time to enter it.
 

Attachments

  • aud.gif
    aud.gif
    18.9 KB · Views: 6,246
Last edited:
We are really scratching the surface here.

As more of a list to remind myself rather than hype this up, I am going to show you over the course of this thread:

- How to sometimes "cheat" your SB broker for an optimal entry into the market

- The discretionary element in pin bar trading: What makes a good pin?

- Other types of price action that can be even more profitable.

- Where to place buy and sell stops when you enter the market

- The best way to trail an exit stop

- How to understand the rhythmn of the market. The single BEST time to enter the market in my opinion. Much of the time the market is a chaotic mess. But I am going to show you a window of opportunity where the market moves cleanly and beautifully

- How to find the optimal place to add to your positions so your risk decreases and your reward increases

- How I still frequently nearly come off the rails and how to avoid it

- What to do if the market gaps very badly against you

- How I do or do not position myself when the market attempts new highs

- The only time I look at an indicator

- The two things that many traders love to look at that I ignore

- Find out if your thought processes are stopping you making money OR more simply: Is there a difference between what you want to do and what you are good at doing?

Edit: haha just read this again - it reminds me of one of those cheap scams you get. Try this new system out - guaranteed to make you 18,000% in 3 months...rest assured - IT'S NOT 🙂
 
Last edited:
Status
Not open for further replies.
Back
Top