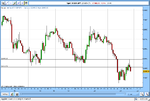
This is not a pin bar entry/exit. Its more of a price action and fibo trade.
Entry on 19th (monday) evening at 509. Reasons - bullish candle and 50% fib support. Stop 140 pips away.
Target - where 23.6 ( 4hr chart) and 38.2 ( daily) fibs are getting close together, possible confluence.
Was making 160 pips this morning, now about half of that 😱
Still holding.
Any thoughts on the confluence at target ?
Er..chart next page!
Hello Combotrader,
I'm afraid you've made some mistakes with your fib levels.
Fibs take a while to get to grips with so don't worry.
Let me explain:
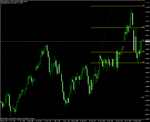
Chart 1
This is the first fib you have drawn and it was drawn CORRECTLY. However, you are READING IT wrong as it is of no use as a target.
The purpose of this fib is to measure how much of that swing up, from approximately 1.99 to 2.1150, the market will retrace.
As you can see, it retraced close to 61.8% of the move up.
So this fib level was meaningful when the market was FALLING but now it is RISING we need to draw a new fib.
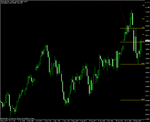
Chart 2
This is what you attempted to do here. You wanted to show how much of this swing down will be retraced. Anotherwords, how much of that previous move will the market UNDO before turning again.
However, this time you have drawn it WRONG.
You must always draw your fib levels FORWARDS and NOT BACKWARDS as you have done here. The quick way you can see that you have drawn it wrong is to look at the percentages.
If we are measuring how far the market is going to retrace up from this swing low, then the lowest percentage must be CLOSEST to the price. That makes perfect sense because once it retraced 50% that is further than 38.2%. Since it is further, it must be be MORE of a retrace and therefore higher up.
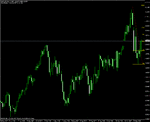
Chart 3
This is the CORRECT way to draw the fib. As you can see price has retraced over 38.2% of the recent sharp swing low and is now holding above that level.
SUMMARY
Fibs can be difficult to get to grips with at first. I always found them rather daunting until I took some time to understand them and now drawing them is simple and requires little thought.
Here are two important rules:
If the market is trending UP, you draw the fib from LEFT to RIGHT. From SWING LOW to SWING HIGH.
If the market is trending DOWN, you draw the fib from LEFT to RIGHT again but this time you draw from SWING HIGH to SWING LOW.
If you need further explanation, try doing some research on the web on fib levels and how to draw them. This is what I had to do to fully understand how to draw them.
I have watched a few videos on Youtube for you. Many of them don't explain the process very clearly. Here is one of the better ones I found:
http://www.youtube.com/watch?v=R6ft90FLI-I&feature=related (ignore the fact its on the 5m timeframe and please note that I don't use fib extensions as profit targets)
Tom


