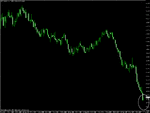
1st 50 reached and now banging on resistance - 250 to go.Orders executed at 0.6950 by RBS FX Prop 100 pips stops and 300 pip target.
You are using an out of date browser. It may not display this or other websites correctly.
You should upgrade or use an alternative browser.
You should upgrade or use an alternative browser.
Making Money Trading
- Thread starter trader_dante
- Start date
- Watchers 334
- Status
- Not open for further replies.
trader_dante
Veteren member
- Messages
- 4,535
- Likes
- 1,704
Cheers TD.
I've obviously got mixed up and lost my way with what you've been saying somewhere through the thread. I thought you set up on the daily having identified a pinbar and determined relevant S/R levels then zoned in on the hourly to watch/wait for your entry to be triggered.
Dan
No - this is not quite right.
Here is what I do on each TF:
Daily:
First I zoom out so I have at least one years worth of data on my chart and sometimes even further if price is reaching for new highs or lows.
Then I go through and mark off key S/R paying close attention to areas where it has flipped between the two. These pivots are very important to me.
Then I draw in fibs from the major swing highs and lows. If the fib levels are not near the price action I will take them off once I have noted where they are otherwise the chart can get too busy.
I have the 10, 21 and 50 EMAs always on my charts. So I look at price and see where it is trading in relation to those also. (I explained in an earlier post how these EMAs help me understand the rhythm of the market)
If I see a pin bar or other price action setup such as an inside bar at ANY of my levels then I will enter, place my stop and then eventually exit, all on this timeframe.
Today I took the Eur/Gbp long based on the inside bar that has tested the top of a descending triangle. This is my FIRST trade based on the monthly TF using my price action setups.
If you look at the hourly TF of this pair you will see that I entered almost right at the top of a significant run up. This is because the entry is based on the monthly and the hourly is therefore NOT a consideration.
The ONLY exception to enetering on the TF I see the action on is if the stop is simply too large. There was a pin on GBP/JPY in August that needed a 980 pip stop. 🙂 So when I can't use the required stop (which would be beyond the nose of the pin) then I go onto the hourly TF to see if I can enter with more precision and less risk.
Now lets say when I am scanning these daily charts and higher I see a pattern such as a descending triangle or interesting price action such as a significant bull or bear run but I don't see a significant setup. What do I do? If this happens, I put it in my portfolio to look at on the hourly TF.
Hourly:
Every hour I pull up a chart of the 20 or so markets in my portfolio.
What markets are in my portfolio?
There are some markets that are ALWAYS in my portfolio because I have experience with them e.g. Crude Oil, Gbp/Usd, Gold, FTSE etc.
Otherwise they are the markets that I have seen something interesting on, on a higher TF, which I have therefore put into my portfolio. Perhaps I saw a large decline on the daily heading into a support. Then I will look at it on the hourly to see if a pin bar forms at this support.
The areas of S/R etc are, remember, ALREADY marked on them on the daily TF so they filter down to my hourly. As a result, all I need to do is to look for additional support SPECIFIC to the hourly TF.
I trade the hourly in the same way I trade the daily. I wait for price to retrace to my levels and I buy or sell accordingly.
I hope this clarifies things. I am worried that I am not clear...🙁
Last edited:
trader_dante
Veteren member
- Messages
- 4,535
- Likes
- 1,704
1st 50 reached and now banging on resistance - 250 to go.
I am not sure if everyone understood smbtnt when he said that a long Eur/Gbp order was executed by "RBS FX Prop".
I thought that was the name of his broker at first 😱
He means that a professional trader for RBS has taken the same side as me, just a little earlier! 🙂
Cheers TD.
I've obviously got mixed up and lost my way with what you've been saying somewhere through the thread. I thought you set up on the daily having identified a pinbar and determined relevant S/R levels then zoned in on the hourly to watch/wait for your entry to be triggered.
Dan
Hi Dan,
I remember TD draws S/R levels in daily and move thru 1 hour chart and if any pinbar identified, check for confluence, S/R, Fibs , any further pivots to draw in hourly and then enter trade accordingly...
I feel sometimes pinbar in daily may not have similar pinbar setup in hourly chart...
If iam wrong anywhere TD can clear further....😀
Fxbee
lurkerlurker
Senior member
- Messages
- 2,482
- Likes
- 150
Well, we've had a double low on the hourly which is higher than the low printed by the pin I entered on the break of. We had a higher high on the 5pm pin, but this hasn't been taken out yet. We've gone back and touched my entry price again, and there is only one more hourly bar to be printed tonight.
Wondering whether to pull my stop closer in before we shut for the weekend. Perhaps below the double bottom - save myself 30 pips or so.....
I don't think I'll end up doing that though. If I was marginally stopped out and then it took off abruptly I'd be annoyed.
In addition to the technical setup (50% fib on long time frame, strong daily / weekly support), hourly pin, I think there are some fundamentals in favour of this trade. Risk has been repriced once again today, but nothing has fundamentally changed. We've heard from the BoE this week, and the GBP hasn't devalued too sharply. I think the carry trades are still on. The market is a little extended and there will be a pullback. Even if all of this is nonsense, I can still just trade the price action on the chart.
pinbar ftse
Hi TD
Thought this chart could be useful to newbies like me to learn.
You too pls have a look at it and let me know your views...
First pin circled from extreme right doesnt qualify to be a pinbar exactly...though it shows good potential trade on hindsight....
Fxbee
Hi TD
Thought this chart could be useful to newbies like me to learn.
You too pls have a look at it and let me know your views...
First pin circled from extreme right doesnt qualify to be a pinbar exactly...though it shows good potential trade on hindsight....
Fxbee
Attachments
Last edited:
lurkerlurker
Senior member
- Messages
- 2,482
- Likes
- 150
GBP/JPY gone back up through my entry, coming into important resistance. I'll feel better about holding over the weekend if we can put in a new high here - that would be 2 higher lows and 2 higher highs since my entry.
Anyway, I'm watching this too much - I guess I am just not used to working on the longer time frames, but to my credit I've not messed about with the trade yet, and I've been in it for a whole 3 hours!
Anyway, I'm watching this too much - I guess I am just not used to working on the longer time frames, but to my credit I've not messed about with the trade yet, and I've been in it for a whole 3 hours!
Reas
Junior member
- Messages
- 43
- Likes
- 9
I hope this clarifies things. I am worried that I am not clear...🙁
TD, you're very clear! in my opinion you're a very good teacher.
I would have lost my patience long ago, but you just keep repeating, excellent work!
Allthough i think a lot of these questions wouldn't have to be asked if people read your postings more carefully.
But on the other hand the repeating is also a strong teaching method.
cheers
Reas
lurkerlurker
Senior member
- Messages
- 2,482
- Likes
- 150
A higher high by a few ticks (lets call it a double top until it is taken out), and I've just been paid my interest for being long GBP over the weekend - added some pips to the trade. Last bar forming now - if TD drops in before 9 I'd gladly take some advice on stop placement, otherwise I'm leaving it at 231.00 dead.
trader_dante
Veteren member
- Messages
- 4,535
- Likes
- 1,704
Last bar forming now - if TD drops in before 9 I'd gladly take some advice on stop placement, otherwise I'm leaving it at 231.00 dead.
I'm always watching bro.
If I was in this, I would have my stop just beneath the two bar low.
P.S. I like to trade countertrend too but it really looks like you just stepped infront of an avalanche. Good luck.
Attachments
trader_dante
Veteren member
- Messages
- 4,535
- Likes
- 1,704
Hi TD
Thought this chart could be useful to newbies like me to learn.
You too pls have a look at it and let me know your views...
First pin circled from extreme right doesnt qualify to be a pinbar exactly...though it shows good potential trade on hindsight....
Fxbee
forexbee, you are a model student!
This is a really good way to learn and you have circled some good looking pins.
I would advise those that are new to this to backtest the strategy thoroughly.
I use a broker called North Finance for their charting. You can find their website here: http://www.northfinance.com/
They offer a free download of MetaTrader4 which includes FREE real time charting on all FX pairs (majors, minors and exotics), many commodities including Crude Oil, Wheat, Soyabeans etc, the Dow and several US shares.
When you load up MT4 go through the markets you are interested in. There are years of data on each pair.
Go back to the earliest date on each timeframe you are interested in and draw in the S/R levels as I have shown you, based only on what you can see on the screen.
Then you can press F12 on your keyboard to go forward one bar at a time. As you progress through, update your S/R levels etc and wait for bars that react to them. It is a time consuming process but if you do this methodically it will prove invaluable.
You may get some very good ideas of your own when you do this.
Last edited:
That's 3 times the hourly has failed to penetrate the same price (GBPJPY).
On the plus side the low a few bars back touched the weekly S2 - and according to my chart the daily is resting on the 365MA....
That's a pretty meteroic fall to bet against...
Edited to add - being cautious I'd wait for the 232.35 high to go....
On the plus side the low a few bars back touched the weekly S2 - and according to my chart the daily is resting on the 365MA....
That's a pretty meteroic fall to bet against...
Edited to add - being cautious I'd wait for the 232.35 high to go....
lurkerlurker
Senior member
- Messages
- 2,482
- Likes
- 150
Post 2000, my first profitable week in a month, and a trade which looks like it will get stopped out in the last 4 minutes of trading today, before it opens 1 big figure up on Sunday! Going away from the screen until 9pm, then will check if I'm still in. It doesn't look likely though!
edit - yes it is catching a pretty big falling knife! If I can just ride the last 3 minutes I'll be fine. This will open up on Sunday - I'll consider taking profit if there is a large gap, and will BE the stop on a smaller gap. If it doesn't move much, I'll keep stops at 231.35. Oh, this is getting too close! I'm within 15 pips of getting stopped out.
edit2 - IG - 9PM - close your damn market!
edit3 - stopped out at 231.35. Why oh why didn't I keep my stop where it was!
Last edited:
😆edit2 - IG - 9PM - close your damn market!
Best of luck with it Lurker, even my adrenaline is flowing...
Very interesting thread T_D, and very selfless of yourself to put so much time into it, well done.
trader_dante
Veteren member
- Messages
- 4,535
- Likes
- 1,704
Lurker,
It is clear from the number and neurotic content of your posts that you are far too emotionally attached to the outcome of this trade. You have to work hard on this. You cannot trade effectively in this state of mind. You should strive to view each trade with an almost scientific detachment.
It is clear from the number and neurotic content of your posts that you are far too emotionally attached to the outcome of this trade. You have to work hard on this. You cannot trade effectively in this state of mind. You should strive to view each trade with an almost scientific detachment.
trader_dante
Veteren member
- Messages
- 4,535
- Likes
- 1,704
Setups for next week
These are the setups I am looking at next week. These are NOT market calls.
They will become market calls IF and WHEN I put my order into the market.
Wheat:
Timeframe: Daily
Anticipated movement: Long
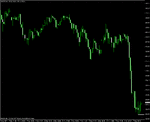
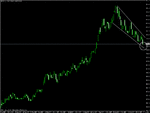
Price action setup: Pin bar at the bottom of a falling wedge
How will I play it?: Wait to see where it opens and react accordingly. Placing an order BEFORE the open risks serious slippage.
Attachments
trader_dante
Veteren member
- Messages
- 4,535
- Likes
- 1,704
Setups for next week *continued*
Gbp/Usd:
Timeframe: Weekly
Anticipated movement: Short
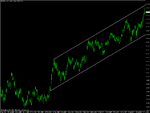
Price action setup: Pin bar at the top of a channel
How will I play it?: Risk is too large to place a stop above the weekly pin as the range is almost 400 pips. I will look for an entry on the daily timeframe
********************
I am fully aware this is an extremely counter trend trade. I have had significant success trading these bars that I am comfortable taking this. Never trade a setup you are not comfortable with. You must be extremely confident when you trade. It is vital to your successful management of a position.
********************
Attachments
trader_dante
Veteren member
- Messages
- 4,535
- Likes
- 1,704
Setups for next week *continued*
Usd/Cad:
Timeframe: Weekly
Anticipated movement: Long
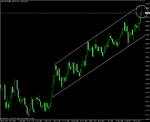
Price action setup: Pin bar at an extreme low with price closing AT the highs confirming the bullish reversal
How will I play it?: Risk is too large to place a stop below the weekly pin as the range is almost 400 pips. I will look for an entry on the daily timeframe.
********************
I am fully aware this is an extremely counter trend trade. I have had significant success trading these bars that I am comfortable taking this. Never trade a setup you are not comfortable with. You must be extremely confident when you trade. It is vital to your successful management of a position.
********************
Attachments
forexbee, you are a model student!
I would advise those that are new to this to backtest the strategy thoroughly.
I use a broker called North Finance for their charting. You can find their website here: http://www.northfinance.com/
They offer a free download of MetaTrader4 which includes FREE real time charting on all FX pairs (majors, minors and exotics), many commodities including Crude Oil, Wheat, Soyabeans etc, the Dow and several US shares.
When you load up MT4 go through the markets you are interested in. There are years of data on each pair.
You may get some very good ideas of your own when you do this.
Hello Trader D
A couple of quick questions :
I've never come acros MT4 before (perhaps because I haven't traded forex), but is it just a charting package with real time updates ? And if you open a demo account with North Finance, that's all you need ? (and the trades are actually done your spreadbetting account separately ?)
On a general note of the pin bar strategy. Say you have a daily pin set up on a chart. It is a good looking pin with confluence of fib and/or pivots points. So you decide that you want to enter a long/short once the pin high/low has broken the next day. If the market has gapped up/down somewhat at the start of the day (e.g the spreadbet firms often have the index quote up/down from prev days close before the market opens ?)...what do you do ? Is it just discretionary ? e.g if there is a big gap then your risk is obviously larger and so you don't take the trade ?
And would you open a position with a stop limit order, so if it came back to your level during the day it would open a position for you ?
Thanks very much for all your help so far.
- Status
- Not open for further replies.
Similar threads
- Replies
- 3
- Views
- 2K


