Making Money Trading

Which market do you want to learn to trade?


  • Total voters
    101
  • Poll closed .
Status
Not open for further replies.
Hi Jitasb,

I've never come acros MT4 before (perhaps because I haven't traded forex), but is it just a charting package with real time updates ? And if you open a demo account with North Finance, that's all you need ? (and the trades are actually done your spreadbetting account separately ?)

MT4 is a charting package with real time data that you can trade directly with your broker through. There are many different brokers providing demo accounts with access to different markets. I use Northern Finance. It doesn't quote all the markets I like to look at so then I rely on my SB broker. All trades are placed through this SB broker.

On a general note of the pin bar strategy. Say you have a daily pin set up on a chart. It is a good looking pin with confluence of fib and/or pivots points. So you decide that you want to enter a long/short once the pin high/low has broken the next day. If the market has gapped up/down somewhat at the start of the day (e.g the spreadbet firms often have the index quote up/down from prev days close before the market opens ?)...what do you do ? Is it just discretionary ? e.g if there is a big gap then your risk is obviously larger and so you don't take the trade ?

Good question. This is why I like the forex markets because being a 24hr market you don't have to deal with this problem (unless the gap is over the weekend).

How a trader acts is discretionary and depends on their risk profile. I will give you a few examples of how I would act in different situations:

For all of them I will assume, as you said, price has formed a pin and there is VERY GOOD supporting evidence to indicate a move in the direction anticipated:

If the Pin is closing AT or EXTREMELY close to its highs/lows (see my previous chart on Usd/Cad):

If the risk is fine in terms of number of pips, I will enter just BEFORE the close of the pin and therefore BEFORE it is valid. To do this, I would need to see that the price, in the final minute of the close, is at or within a few pips of the high or low of the day.

My reasoning for entering early is that if it closes AT its highs then this is added confirmation of the strength of the reversal and since my usual entry is only one tick above the high, if it gaps I will almost certainly miss the move. If the pin is a good one (and as you may have realised by now I am very selective) then I will take the added risk.

If you are not already in and the market opens and gaps PAST your entry:

As you said, depending on the size of the gap, the risk on the trade becomes larger with a later entry and as a result I will ALWAYS let it go without me. In the early days I used to think to myself: "Well, no problem I will enter higher up but I'll move my stop up the equivalent number of pips to mitigate the extra risk". The problem with this is that from time to time, these trades can retrace a good deal against you before they turn and become profitable. The only place where your setup is INVALID is beneath the pin.

And would you open a position with a stop limit order, so if it came back to your level during the day it would open a position for you ?

This sounds perfectly logical but I actually DON'T do this. Many, many times you will find that the pin will trigger and then after moving in your direction will turn and then retrace to your entry point (the top of the pin) before really taking off. So it sounds reasonable to place a limit at your entry if you miss it. HOWEVER,despite being aware of this, I still don't like to enter when the price is going AGAINST my originally anticipated direction. So, if I miss it, I leave it. I am not saying this is the right way but this is just what I do.
 
Last edited:
Just a quick word to say that this will all start to make more sense the more you see me take actual trades. So far I have only discussed one live trade thoroughly from entry to exit (Aud/Cad) and the reasoning for the entry of my second live trade (Eur/Gbp) which I entered yesterday and is still in its infancy being off a monthly TF.

I am very selective and don't trade that often but it looks like there are some good setups next week and if I get an entry and they move in my favour hopefully you will learn something about the very important area of trade management.

It is how you manage the risk once you are in a trade and not the exact point that you enter that determines whether you will be profitable in the long term.
 
Hi TD,

Looking at the chart on Post 236, at the highest bar on it. Now go back 8 bars. I would have shorted on that one and been stopped out. Would you have seen that as a mistaken opening and, if so, what would have made you decide against it?

I appreciate that some of these trades are going to be failures, but is there something there that should have made the trader avoid it?

Split
 
Is this a pin bar ?

Hi TD

Andys Mrs here again

Just went out on a flyer :cheesy: hope I was right , should have really consulted you first about it but just was"nt the time

Pin formed in hour candle above open hour range at previous days high

Re- test of swing low breach, breached previously by gap following poor session on Dow. Index had closed the gap previous day and looked to be continuing the same in early trade with an early re-test of previous days high.

Clues all was not well ~ previous days action on low volume and 69 lose 31 win on day

The Mrs

Who as just taken out Andys entire months intra day pts total in one trade and still as a bit left on :LOL: :LOL:

Andys well :eek: :eek:
 
Last edited:
Hi TD,

Looking at the chart on Post 236, at the highest bar on it. Now go back 8 bars. I would have shorted on that one and been stopped out. Would you have seen that as a mistaken opening and, if so, what would have made you decide against it?

I appreciate that some of these trades are going to be failures, but is there something there that should have made the trader avoid it?

Split

Hi Split,

Sorry for the delay - this took a little time to research and find the exact pin in question as the bars are very different on my YM feed.

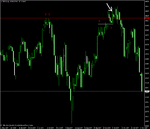
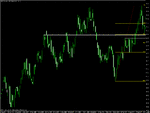
** First chart attached is the failed pin that Split is querying **

That looks like a fair enough trade to have taken based on the information we can see on this chart alone. It's a pin and it appears at a minor double top on the 4hr.

I'm not going to try and defend against failed pins. Losses will occur. Sometimes pins with multiple supporting factors will fail.

HOWEVER, a few things to bear in mind with regard to this pin:

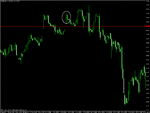
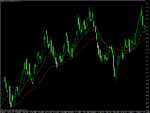
a) On the daily TF the Dow had failed a break above the July highs but it had found support over three consecutive sessions, forming a minor PIVOT just below the high. See chart 2

On the day of your failed pin (see arrow) the Dow was pushing up into these highs again.

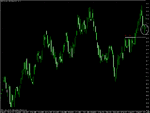
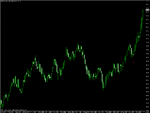
Now, that key high, marked with the red horizontal line, filters down to the lower timeframes. Have a look at Chart 3 of the 4hr on my YM feed.

The circled area is where that 4hr pin appeared. As you will see, you are shorting directly into the highs.

Incidentally, look where it found support. With a pin bar of sorts too! :)

b) Remember, I don't trade this method 4hr :)
 

Attachments

  • dow3012.gif
    dow3012.gif
    17.1 KB · Views: 1,743
  • dow1.gif
    dow1.gif
    21.9 KB · Views: 1,797
  • dow2.gif
    dow2.gif
    21.9 KB · Views: 1,619
Last edited:
Crude Oil *Weekly chart*

I want to take this chance to show you how many of the elements we have discussed so far come into play to give a killer trade.

Look at how the weekly Crude Oil chart in August shows a pin bar with:

A long nose;
A small body;
A body contained within the range of the bar to the immediate left

The first thing that is of immediate interest is that this pin bar reversed not far above a previous area of important resistance.
 

Attachments

  • crude1.gif
    crude1.gif
    25.3 KB · Views: 2,461
Last edited:
Crude Oil *continued*

The other thing that should quickly be discernible is that the pin has reversed very close to a significant S/R pivot that has been in play for two years.

Remember that these s/r pivots are often not exact they should be viewed more as zones.

So at this point without looking at anything else we are seeing that strong buying is coming in at these two important levels.
 

Attachments

  • crude2.gif
    crude2.gif
    25.2 KB · Views: 2,087
Crude Oil *continued*

Drawing fib levels on from the major swing low in December we can see that there is confluence with our S/R pivot and the 38 retracement level.
 

Attachments

  • crude3.gif
    crude3.gif
    26.1 KB · Views: 2,192
Crude oil *continued*

At this point we've got enough support to take a position but I always have the 10, 21 and 50 EMAs on my charts and as explained in an earlier post, use them to help me understand the rhythm of the market.

I've taken everything else off the chart here to show clearly how the 50 is trending up (the pullback in prices eased the angle of the 50 slightly but it is still clearly trending) and the price has pulled back into the zone of the 10 and 21.

As I have explained before, a pullback in a trending market is a NATURAL part of its movement. When prices reach this zone I look for a continuation in the original direction.
 

Attachments

  • crude4.gif
    crude4.gif
    32.1 KB · Views: 2,524
Crude Oil *continued*

Final chart cleared of all our levels.

Pin is marked with the arrow.

Look at how the two bars to the immediate left of the pin make almost equal lows. Then look at how the market retraces, on the next bar after the pin near, once again to the lows of the left eye showing strong support over three weeks.

Once the pin was triggered, a stop could have been placed below these three bars to cut the risk. This is a slightly more aggressive technique in stop placement that I will sometimes use but remember, the conservative way to play these bars is to place the stop BENEATH the pin itself.
 

Attachments

  • crude_final.gif
    crude_final.gif
    19.2 KB · Views: 2,429
Last edited:
Thanks TD,

Chump pointed out to me that I was trading against the main trend, too. I should have seen that. I'm a bit of a contrarianist, always a dangerous profession! I'm trying to get out of that habit, but habits are hard to change.

Split
 
Lurker,

It is clear from the number and neurotic content of your posts that you are far too emotionally attached to the outcome of this trade. You have to work hard on this. You cannot trade effectively in this state of mind. You should strive to view each trade with an almost scientific detachment.

Thanks for the advice. I got too attached because I moved the stop below the low of the 2 hourly bars rather than the low of the pin a few minutes before the markets closed, and then it started running at my stop, and I panicked. I didn't mess about with the trade, or cover early, but I did start to panic. I was stopped out for -85 eventually.
 
Sorry my mistake again

Andys Mrs should read this earlier post of mine: http://www.trade2win.com/boards/showpost.php?p=369131&postcount=398

Look familiar? ;)


:eek: :eek: :eek: :eek: :eek:

Andys Mrs was to busy minding her work, did"nt want to burn my cakes :LOL: :LOL:

Sorry TD, thought it was a good example to show your followers, I am not watching intraday and missed your post, and lazy to so must do better.

I play it at that S&R point anyway regardless of pin, a rejection of price in whatever form at that level is good for me ;)

The breach of the swing low and the re-test during a live market session of that area makes the signal good and indicates a change of trend for many swing traders using ganny and similer methods. Fib level & Pin bar close so thought I would pop post here :cheesy:

To make up find a chart with ma"s and 3 time frame view

Purple = open hr range
Blue = previous wks hi and lo

Sorry for interuption TD
 
Last edited:
Hi Split,

Sorry for the delay - this took a little time to research and find the exact pin in question as the bars are very different on my YM feed.

** First chart attached is the failed pin that Split is querying **

That looks like a fair enough trade to have taken based on the information we can see on this chart alone. It's a pin and it appears at a minor double top on the 4hr.

I'm not going to try and defend against failed pins. Losses will occur. Sometimes pins with multiple supporting factors will fail.


HOWEVER, a few things to bear in mind with regard to this pin:

a) On the daily TF the Dow had failed a break above the July highs but it had found support over three consecutive sessions, forming a minor PIVOT just below the high. See chart 2

On the day of your failed pin (see arrow) the Dow was pushing up into these highs again.

Now, that key high, marked with the red horizontal line, filters down to the lower timeframes. Have a look at Chart 3 of the 4hr on my YM feed.

The circled area is where that 4hr pin appeared. As you will see, you are shorting directly into the highs.

Incidentally, look where it found support. With a pin bar of sorts too! :)

b) Remember, I don't trade this method 4hr :)

Hi TD,

Circled bar doesnt look like pin, could you clarify which one you mean...? Near the arrow marked and circled in chart 3 has long body and tail again not that long....Would you pls point it ...:rolleyes:

Pls see iam referring to post #446
Fxbee
 
TraderD Method and US Stocks.

Hello.

Although the poll winner was indicies, I have been initially looking at this method as applied to US stocks. Primarily because I think it is slightly easier to apply a "new" method to what I normally trade and to the market that I am currently most familiar with. So I have posted some charts below along with my thinking about them.

I would appreciate any comments from Trader D (or for that matter, other readers) on my interpretation of these charts and how I have used the TraderD method.

US Stock: AMED
TF: Daily


Chart 1 just sets the scene really. It is a daily chart snapshot after close on 10th Oct. The reason I've used it is because I was actually watching this stock for a few months prior and had it in my watch list on that day. The orange line shows resistance initially which when broken was restested and became support (so a good s/r pivot line). Doesn't come into play later, but it seemed like a good illustration of the principle.
The top blue line is most recent high and the pink line is a upward sloping trend line linking 'obvious' swing lows.

Chart 2. Let's fast forward to the current day. I have changed the chart view to show the last 6 months since it is easier to see the candles. The 3 lines are as for chart 1. Note the second last candle on the chart (for Thursday 08th Nov).
It has the makings of a good "pin bar" ? Long nose, small body contained with body of left candle, and the nose extends into "space".
In addition the low of this pin bar bounces off the blue line. I.e. Previous resistance has now become support ( a good pivot line), so some added confluence. In addition the low of the pin bar is in the "area" of the upwards sloping trend line : more confluence ?

Chart 3.
This is same view as Chart 2, but I have added FIB lines between the low and the high of after the stock gapped. Again notice that the pin bar low is almost exactly at the 50% Fib level. So some more added weight to the pin bar.

Summary.
I would be currently thinking that this pin bar has some good confluence with it. On Friday (the last candle) we had an inside bar, which potentially could reduce our risk if we want to go long. Aside from that though, the pin bar has a stop of $2. Looking forwards, the next likely resistance from a good run up would be the previous high which is also $2 away, so perhaps the R:R is not the best (i.e. just 1:1).

Thanks.
 

Attachments

  • Chart of AMED-3.gif
    Chart of AMED-3.gif
    19.5 KB · Views: 1,289
  • Chart of AMED-2.gif
    Chart of AMED-2.gif
    18.6 KB · Views: 1,302
  • Chart of AMED-1.gif
    Chart of AMED-1.gif
    21.7 KB · Views: 1,354
Eurnzd

Hi TD,

I wonder if you can analyze the charts below.
I realize that the open and the close of the pin are not within the eye. On the other hand the pin is at the 123.6 fib,on the hourly taken from the low of Nov.8. The 4 hour chart is showing kind of a triple top (?) with the previous two highs. Well, it's a little bit of a stretch, but hey, work with me here... On the daily , if I am creative enough,it sits on the 50% fib.
At this point I ran out of excuses/justification /confluences etc ... Actually, the candle also sits on the monthly floor pivot.
:cheesy:
Thank you
 

Attachments

  • td1.gif
    td1.gif
    11 KB · Views: 1,147
  • td2.gif
    td2.gif
    11.3 KB · Views: 991
  • td3.gif
    td3.gif
    12.5 KB · Views: 1,073
Hi TD,

Circled bar doesnt look like pin, could you clarify which one you mean...? Near the arrow marked and circled in chart 3 has long body and tail again not that long....Would you pls point it ...:rolleyes:

Pls see iam referring to post #446
Fxbee

Fxbee,

The bars on my chart are different to the ones on Splitlinks.

I circled the area which corresponds to the pin bar on his chart - as you can see it is not a pin bar on mine.

The bar marked with an arrow in chart 2 is to show what was happening on the daily timeframe at the time he was considering entering on the 4hr.

Tom
 
Good stuff Jitasb

Although the poll winner was indicies, I have been initially looking at this method as applied to US stocks. Primarily because I think it is slightly easier to apply a "new" method to what I normally trade and to the market that I am currently most familiar with. So I have posted some charts below along with my thinking about them.

I would appreciate any comments from Trader D (or for that matter, other readers) on my interpretation of these charts and how I have used the TraderD method.

Hi Jitasb,

First off - this is excellent analysis.

Absolutely spot on with your S/R pivots and fib levels.

A couple of points to make:

Firstly, although you have correctly identified a pin, I would ideally like to have seen the body lower down the candle immediately to the left. I really like to see these candles hanging down.

Secondly and this is personal to the technician, I lose faith in a trend line that has been broken for a significant period of time as happened here. I will keep the original line on my chart for a while afterwards to see if it retested from below but usually don't give much weight to a break back above it. I will instead re-draw in a new one. This is just my way of working with charts and other traders may do things very differently as technical analysis is a very subjective art.

Thirdly, the market clearly didn't react to the setup as bullishly as we would have expected, instead it formed an inside bar. This does not mean you have to pass on the opportunity but you may see it as a warning sign. If I was looking for a long position I would be wanting to see some upside momentum very soon. In addition, if I was to take this long, I would be looking to play a break of this inside bar upwards for a better R:R.

In the meantime, I have a question to ask:

Can you post the same chart with:

i) A fib level drawn from the previous swing low (marked with an arrow on the chart) By sight alone I would say that the low of the pin bar would fall at or close too the 38, in which case you have added confluence.

ii) The 10, 21 and 50 EMAs on.
 

Attachments

  • amed.gif
    amed.gif
    20 KB · Views: 1,573
Last edited:
Hi TD,

I wonder if you can analyze the charts below.
I realize that the open and the close of the pin are not within the eye. On the other hand the pin is at the 123.6 fib,on the hourly taken from the low of Nov.8. The 4 hour chart is showing kind of a triple top (?) with the previous two highs. Well, it's a little bit of a stretch, but hey, work with me here... On the daily , if I am creative enough,it sits on the 50% fib.
At this point I ran out of excuses/justification /confluences etc ... Actually, the candle also sits on the monthly floor pivot.
:cheesy:
Thank you

Hey Milan47,

You already know what I am going to say about this setup, don't you? ;)

You are really clutching at straws with this one.

Having said that, you have very correctly identified a key area to watch.

Let me go through each of your charts (not included here) and give you my thoughts:

Chart 1 - 1hr:

Firstly and most importantly, the pin on the 1hr chart has a body that is too large in proportion to its fairly short nose. Secondly, I don't personally use fib extensions. That is not to say they don't work it's just to say that I have not had any experience using them so I cannot comment on their effectiveness. At any rate, I can tell you that even if I did use these I would want to see the nose of a pin hitting them as close as you can get to dead on and not have it breaking right through as it did here (regardless of where it closed)

Chart 2 - 4hr:

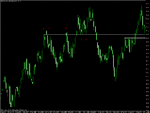
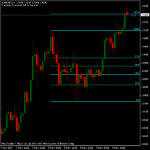
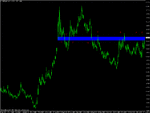
You have pinpointed a very good area of resistance here. I zoomed out on the same TF and found this area is a significant pivot. I have marked this zone in blue. See my chart attached.

Chart 3 - Daily:

This is a very bullish candle right into our resistance area. I would be very reluctant to take a 1hr short setup in the face of this.

milan47,

I would suggest to watch your marked area and see how the market reacts to it.
 

Attachments

  • eur_nzd.gif
    eur_nzd.gif
    20.8 KB · Views: 1,509
Last edited:
Status
Not open for further replies.
Top