You are using an out of date browser. It may not display this or other websites correctly.
You should upgrade or use an alternative browser.
You should upgrade or use an alternative browser.
Making Money Trading
- Thread starter trader_dante
- Start date
- Watchers 334
- Status
- Not open for further replies.
trader_dante
Veteren member
- Messages
- 4,535
- Likes
- 1,704
Wow 😱
That's great TD, i will keep those MA's in sight, thanks for this next step.
I will show you some great setups where all these elements come together but it's a waiting game.
I scan the markets almost every hour of every day whilst at work and when I come in, I watch it until I go to bed and still I rarely trade.
Patience is hard but it is vital to success in this game. It has cost me a lot of money to learn that.
black bear
Guest
- Messages
- 1,303
- Likes
- 165
Homework for the real Boss
Hi TD
Its not me, no Andys watching telly with his feet up after a hard days daytrading.
This is the real Boss his Mrs 😱 because he is not allowed to post anymore its to distracting for him. Men just can"t multy task 😛
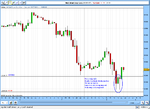
is this what you mean, is this one on the Dow tonight TD :?: ,
AKA
The Mrs or the BOSS who"s going to have a lash at this position trading and show Andy how its done 😀
Last edited:
trader_dante
Veteren member
- Messages
- 4,535
- Likes
- 1,704
is this what you mean, is this one on the Dow tonight TD :?:
Hello Andy's Mrs 😉
I'm afraid that's NOT a pin bar - its more of a neutral bar with a very slight bullish bias.
For it to be a pin bar we would want to see the body (open-close) to be near to the highs of the days range.
You can go and put your feet up and watch TV with Andy now.
And get used to sitting around...
Lots of patience needed to be a position trader.
Best of luck in your new venture 🙂
Last edited:
black bear
Guest
- Messages
- 1,303
- Likes
- 165
Sorry
Hi TD
Sorry 😱 😱
removed chart quick before Andy see"s it 😀
Hello Andy's Mrs 😉
I'm afraid that's NOT a pin bar - its more of a neutral bar with a very slight bullish bias.
For it to be a pin bar we would want to see the body (open-close) to be near to the highs of the days range.
You can go and put your feet up and watch TV with Andy now.
And get used to sitting around...
Lots of patience needed to be a position trader.
Best of luck in your new venture 🙂
Hi TD
Sorry 😱 😱
removed chart quick before Andy see"s it 😀
lurkerlurker
Senior member
- Messages
- 2,482
- Likes
- 150
Most traders use moving averages in one way or another but I never had much of an affinity to any particular one.....
However, last year I was day trading a strategy on 5m bars that was based on my close observation of the market. The essence of the strategy was to wait for momentum in the form of a sharp move up or down and then wait for a natural retracement and take a position. I did this by looking only at the price action itself (relative lows and highs) and did not use anything else to help me define an entry point.
This strategy had an excellent win/loss ratio. In fact when I first started I had a string of consistent wins but it was eventually undone by the fact that my stops were placed too far away from my entry resulting in a losing trade taking the profit that was gained from several winners.
Hello TraderD
Sorry to digress a bit from the thread's main stratgey, but from your post above. Out of interest, what criteria were you using to place stops ? I may have misunderstood, but the strategy is essentially opening a position going in same direction as momentum, using a pullback as an entry point ? If for example you were using a swing low to 'define an entry point' then stop could be placed below it ? This would be a 'better' stop (tighter) than entering a trade on trend as it is rising to new highs.
Just curious really as to why you had far stops, as I currently trade a similiar set up.
Thanks.
trader_dante
Veteren member
- Messages
- 4,535
- Likes
- 1,704
Hello TraderD
Sorry to digress a bit from the thread's main stratgey, but from your post above. Out of interest, what criteria were you using to place stops ? I may have misunderstood, but the strategy is essentially opening a position going in same direction as momentum, using a pullback as an entry point ? If for example you were using a swing low to 'define an entry point' then stop could be placed below it ? This would be a 'better' stop (tighter) than entering a trade on trend as it is rising to new highs.
Just curious really as to why you had far stops, as I currently trade a similiar set up.
Thanks.
Hi Jitasb,
I can't remember exactly what I was doing. I think I was watching the retracement and then buying on the first 5m bar that made a higher high than the previous bar but I think I was putting my stop below the PREVIOUS reaction low just incase I hadn't caught the bottom of the retracement.
This led to large stops and the problem was exacerbated because I was trading with a fixed profit target of only 10 pips.
fibonelli
Experienced member
- Messages
- 1,338
- Likes
- 288
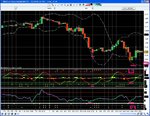
Did anyone take this? (I didn't - stop too wide, and against trend)
LL,
If you add a few indicators, you can see momentum divergence, bollinger band divergence, a change in momentum, two consecutive NR bars and a big round number to the two bullish looking candles!
and that's without looking for more supporting factors like s/r pivots, fibs etc!!
btw I don't trade the Dow.
F
Attachments
lurkerlurker
Senior member
- Messages
- 2,482
- Likes
- 150
LL,
If you add a few indicators, you can see momentum divergence, bollinger band divergence, a change in momentum, two consecutive NR bars and a big round number to the two bullish looking candles!
and that's without looking for more supporting factors like s/r pivots, fibs etc!!
btw I don't trade the Dow.
F
From the top, could you list the indicators and settings you use on that chart please?
If we zoom in you can see that the breakout was tested almost to the pip and an inside bar formed.
An inside bar is where the range of the bar (low-high) is LESS than the preceeding bar.
If you get one inside bar it means that the price is CONSOLIDATING.
If I find inside bars at key levels I like to play them in the direction I anticipate the market to break. In this case it would be upwards.
Hi TD,
From this chart (EURGBP - Monthly) can we say that candle around 1Jun2004 looks like Inside bar (ie after one bullish high candle followed by a bearish candle), is it so?
Fxbee
Last edited:
trader_dante
Veteren member
- Messages
- 4,535
- Likes
- 1,704
Hi TD,
From this chart (EURGBP - Monthly) can we say that candle around 1Jun2004 looks like Inside bar (ie after one bullish high candle followed by a bearish candle), is it so?
Fxbee
Fxbee, can you indicate the exact bar you mean?
trader_dante
Veteren member
- Messages
- 4,535
- Likes
- 1,704
From the top, could you list the indicators and settings you use on that chart please?
Hi Lurker (and everyone else)
Sorry to be acting a bit iron fisted but I am keen to keep this thread on track. I get a lot of PMs from the newer traders that I am trying to help and I know some of them are having some difficulty with what I have shown already without throwing in numerous indicators and different strategies.
I don't want to contradict the great work that Fibonelli does. He is a very thorough technician and is doing interesting work but I need to make this point clear to the new traders: YOU DON'T NEED A SINGLE INDICATOR TO MAKE MONEY IN THE MARKET.
You can beat the market with simple price action and simple support/resistance and NOTHING ELSE on your charts.
I can tell you this with all honesty because I am doing it.
You don't need to make this more complicated than it is.
The only time you ever want to even THINK about looking at an indicator is if you see a pin bar at an extreme swing high/low with NO visible support or resistance. When I find one I will sometimes have a look at JUST the RSI to see if there is any divergence. I put it on, check it and then turn it off. This is the only time an indicator ever makes its way onto my charts.
If you are new to this, adding indicator after indicator will only paralyse your decision making process and distract you from the single most important thing which is WHAT THE PRICE IS TELLING YOU.
Last edited:
firewalker99
Legendary member
- Messages
- 6,655
- Likes
- 613
From the top, could you list the indicators and settings you use on that chart please?
Lurker, I suggest you take a decision on a path you wish to follow: trading with or without indicators. You still seem to be drifting towards several methods and finding out what suits you best. But looking back at the time I posted in your journal, not much seems to have changed. Why try to incorporate 15 different things when you already tried several methods that DO offer profits?
Trader_dante has been very kind and open in his teachings and - no disrespect to other people who trade in different ways - I think he's shown you that you don't need anything else on your chart except for price. Lurker, it's yours for the taking...
PS: excellent previous post trader_dante
trader_dante
Veteren member
- Messages
- 4,535
- Likes
- 1,704
trader_dante
Veteren member
- Messages
- 4,535
- Likes
- 1,704
trader_dante
Veteren member
- Messages
- 4,535
- Likes
- 1,704
Ftse *continued*
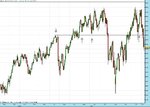
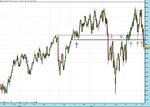
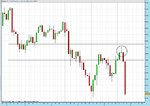
So when we pull up our hourly, you can see where our two key daily s/r pivots are.
Hourly shows us a pin bar with a long nose and a small body contained within the left eye.
The pin bar comes at a swing high in a downtrend. Its nose comes very close to key daily resistance.
This pin has a range of exactly 20 ticks.
Taking is short on a break and having a target of even the lower support level is still a 1:1 R:R.
If you held a stop at breakeven and played for a potential break of this lower level then you are looking at a 130 tick profit so far.
This gives us a reward of 6.5 times our risk.
This is nothing but price action and S/R.
Attachments
Last edited:
So when we pull up our hourly, you can see where our two key daily s/r pivots are.
Hourly shows us a pin bar with a long nose and a small body contained within the left eye.
The pin bar comes at a swing high in a downtrend. Its nose comes very close to key daily resistance.
This pin has a range of exactly 20 ticks.
Taking is short on a break and having a target of even the lower support level is still a 1:1 R:R.
If you held a stop at breakeven and played for a potential break of this lower level then you are looking at a 130 tick profit so far.
This gives us a reward of 6.5 times our risk.
This is nothing but price action and S/R.
Hello TraderD
Would that pin bar with confluence on daily resistance be enough to enter a trade ? Just wondering if you would want more supporting factors e.g. fib and/or pivot point on the hourly chart ?
P.S > When you trade hourly, do you always have the daily s/r lines drawn on before you enter a trade ?
Thanks
trader_dante
Veteren member
- Messages
- 4,535
- Likes
- 1,704
Eur/Gbp
The monthy inside bar is close to triggering my long order.
After the extended run on the hourly bars that we have had in todays session, I will look for a retracement to get in, in ANTICIPATION of the inside bar being broken.
This is NOT something I advise anyone doing because although it cuts your risk, the whole setup and reason for taking the trade is NOT VALID until the high of the IB is broken.
trader_dante
Veteren member
- Messages
- 4,535
- Likes
- 1,704
Hello TraderD
Would that pin bar with confluence on daily resistance be enough to enter a trade ? Just wondering if you would want more supporting factors e.g. fib and/or pivot point on the hourly chart ?
P.S > When you trade hourly, do you always have the daily s/r lines drawn on before you enter a trade ?
Thanks
A pin bar on the HOURLY at SIGNIFICANT DAILY S/R pivots is a strong enough reason to take a trade.
Until you are more experienced and confident with the setups though, I would always advise traders to get as many supporting factors in their favour as they can including fibs and moving averages (or calculated pivots points, if you use these and are familiar with them - I personally don't)
The point of this post was more to make the point that you don't need to use indicators to make your decisions. I try and keep things very simple. Part of my ability to do this comes from experience trading the markets and these setups and finding out what works and what doesn't. Practice this and you will get good at it. It is not difficult it just takes some time.
To answer the last part of your post - YES. Always have your levels drawn on BEFORE you enter a trade. Don't go to the market. Let it come to you. Having your key areas on the chart already will help you react quickly, decisively and confidently when you see an opportunity.
- Status
- Not open for further replies.
Similar threads
- Replies
- 3
- Views
- 2K

