The challenge with Mondays is that they are very often quite thin but there have been a few things to trade today. Was looking to buy USDCAD as well but never gave me the entry I wanted although the H4 picture was pretty straight forward:
If I get a chance later I'll post some top down analysis of what UCAD is likely to do over the next few days / weeks. The picture isn't wholly conclusive at the moment but my longer term view would be bearish. That said, I tend to take either side depending on what price action tells me to do so I rarely conduct anything too complex on the analysis front.
Not over complicating it is a good thing imo, strong support and resistance areas/trendlines are the basis for all my analysis and then I look for the confirmations/ price action in those areas.
1.33495 is an area of interest for me to go short from, horizontal and Trend Line resistance confluence to react from.
The challenge with UCAD is whether one believes price hit weekly supply last week. I don't trade off weekly levels so it's not really a concern for me but, if it did hit weekly supply, then this is what will likely happen next. If it hasn't hit HTF supply yet then we night see some more upside although I won't be watching this pair as there are much more interesting to look at elsewhere :
Not that this is a call but if it's still around 90 when trading starts on Monday (or I've had enough coffee) and there is no clear bullish evidence to contrary, I'll go short with TP areas of 60, 40 and 05.....if the trend gathers a bit of steam I'd be looking at the .7375 pivot/support. The attached chart is .0005 box x 3 reversal but the pivot comes out more clearly on the .001 x 3.
...... short just 1L from 90. I'm not yet convinced that we're heading south in a meaningful way and would prefer another test to get me to enter with a full position - I'm a thirds fan when things look OK to me but am still a bit sceptical atm. ....
Ooops, missed that low - just stopped out at 75 - make that 2 lattés! I think I might have a look at USDCAD - it's one of my more usual and less unsuccessful choices😛
thought i would pop my head in and congrats on a great thread ....
CAD
ive taken the liberty of looking at CADs behaviour primarily as the driver (Cad Index) and then i can look at whats bouncing off of it regarding interesting currency partners / patterns etc
ok the CAD index is here .....lets play daily stuff as easiest
ive taken the liberty of looking at CADs behaviour primarily as the driver (Cad Index) and then i can look at whats bouncing off of it regarding interesting currency partners / patterns etc
ok the CAD index is here .....lets play daily stuff as easiest
OK, so Blood et al seem to be tending toward USDCAD. Herewif is my take which is not too far from Blood's:
I have a short signal from somewhere just below 1.3200. 1st support around the 1.3165/75 area and another about 1.3130 or so. The chart is 10x3 so it's the blunt instrument and I'd come down to 5 or 2.5 x 3 for intra-day set-ups. BTW Rachel: I should have mentioned that I rarely use p&f only for entries and almost always look for confirmation on a bar/candle chart.
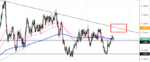
ok - heres where all my indexes are ive pulled out C or CAD on chart .....the other top one is my fixed start date index model ....(not available here at T2win)...i started it from late 2015 to see where currencie have been heading since .....
NOTE - I took GBP off the chart as it is soooo bear it skewed the other patterns ....
Keep up the good work N cheers Pat .....just doing what i'm doing .....day in day out ....turning up !
www.trade2win.com
ok i see on the C cad index indicator a gradually forming Triangle pattern and a push back off Resistance ceiling ........
on the top chart i see a boring Brown cad sitting in the middle of the pack .......Boring to me
so if i were bothered at all in looking for moves i would suggest it will continue south pending next Support action.....you could play it as a seller in a pair .....
however for me this is a pure passive currency at present and i need a more alpha predictable play from another currency to use to lead the trade and make it happen
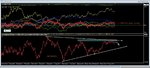
in second slide i bring up the infamous FXCorrelator on a 20ma (Default) ....its on the top .....with CAD possibly looking ready to break bear off resistance then its been interesting since 30/10 .....as CAD got below the zero on FXCorrelator chart ......what to buy against it ? ..........well at that point i see 5 currencies above it so it was quite a pack to chose from ....do some have made money since and others are still struggling ....so signal has gone for this trip
at this moment i would say wait for another pull back on Cad then sell it off again in future - price wise thats impossible for me to call on each currency until i know what CAD is doing ...i look at indexes not pairs for my setups
(and I 95% of the time scalp .....sorry but anything higher in TF doesnt pay my rent)