Best Thread learning to read price action with p/f charts

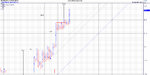
failed signals usually happen at bigger s/r areas
dow h4
testing resistance...but we wont really know if its a failure until we get a bearish semi-catapult
but,nevertheless,we must watch for this even though the chart is still ultra bullish
to make the chart bullish again,we need to close above 13900 on H4.Quite often a new print.ie a new bullish semi-catapult usually implies big resistance
so lets see the reaction at nfp
30mxw6u.gif
 
Last edited:
forgot to mention...to look for fakes
if that semi-catapult break happens,then we look for unsupported columns,usually poles and analyse where support should come in...if it does not then !!
quite often ,there is a change in trend..the week after nfp
just got my new edition of Duplessis book.a few good bits in there.i will try and add them where possible to any charts posted
 
yes... i think it is worth buying
The main rejig is a full chapter devoted to trendlines,which is straight after patterns.which is obviously one of the most important assets of p/f....
THE STUFF WE HAVE BEEN WRITING ABOUT ON THIS THREAD FOR THE LAST 18 MONTHS.
In the previous edition,that was put on the back burner in place of vertical and horizontal counts.This chapter is now after the chapter on trendlines...which it should be.As we said,it was the biggest flaw in the first edition
A few other bits worth noting are
1.the low/high method of construction
2.the ohlc method of construction
3.volume activity histogram
the ohlc construction gives a much wider chart from what i can see.So could be useful with scanning
volume activity histogram.useful for s/r
the new market breadth tools could be useful.there are plenty of these out there
 
update to the dow chart posted before nfp on friday
thge pattern broke to the upside after good nfp numbers
4rcltc.gif
 
yes... i think it is worth buying
The main rejig is a full chapter devoted to trendlines,which is straight after patterns.which is obviously one of the most important assets of p/f....
THE STUFF WE HAVE BEEN WRITING ABOUT ON THIS THREAD FOR THE LAST 18 MONTHS.
In the previous edition,that was put on the back burner in place of vertical and horizontal counts.This chapter is now after the chapter on trendlines...which it should be.As we said,it was the biggest flaw in the first edition
A few other bits worth noting are
1.the low/high method of construction
2.the ohlc method of construction
3.volume activity histogram
the ohlc construction gives a much wider chart from what i can see.So could be useful with scanning
volume activity histogram.useful for s/r
the new market breadth tools could be useful.there are plenty of these out there
I've always wondered what the hell you've been going on about all this time, now I get to read about it :LOL: then its next in my library
 
forgot to mention
as usual,he goes on about his "little babies" ....price targets and mathematical optimisation of p/f charts
Now the Average Joe does not use Updata software and also he is a trader and maybe also does not have the time to put these on.
He just has ignored the main message of how to visually optimise the chart....which is what the average joe wants to do
which is the most important factor in p/f...imho
there are also many pages on which type of chart to use..quite useful
and a little bit about gaps,which is also useful

well I have used the optimisation and its quite surprising that it will come up with settings, worse than mine. So its clearly not optimising very well. It considers sell signals against the trend also. It can be a good starting point, but I've never used. As you say Dentist, the ability to visually see the best setting is more important.

Price targets..I use them all the time, on Updata they truly are amazing. So much so that I have built them into my rules as one of the take profit signals. Ive never seen anything so accurate at forecasting prices.
As for which chart to use..well I doubt I will ever move from close.
But its such a great book, it would be wrong not to get it. As for Updata, its the best.
 
outlook for eurusd next week
upside res at3250 area and supp at 2930 area
H4 data
38 pips by 3 reversal
could go either way...lets see what happens
30tj3ue.gif
 
Malaguti...did you get the bounce from 150 on evraz
i didn"...busy with other things
 
BT 12% up today..pure genius :clap::clap:

chart is a thing of beauty, entered on the break of the triple top
 

Attachments

  • BT GROUP PLC ORD 5P.jpg
    BT GROUP PLC ORD 5P.jpg
    825 KB · Views: 179
Last edited by a moderator:
BT 12% up today..pure genius :clap::clap:

chart is a thing of beauty, entered on the break of the triple top
good stuff
it was good for me aswell,although frustrating at times.took a few days before it pumped
for non p/f traders.here is the weekly line chart
price broke the horizontal res
pulled back
res area became supp
price went sideways for a few days..but supp held till results this morning
nice chart malaguti
5dju54.gif
 
im out now, certainly wasnt looking for any bounce though..where did you get that from?
evraz was a classic recoil fulcrum
price bounced from an oversold state.those steep trends always send them into an oversold state
shame ....not watching after the dump...was busy with other things
 
aberdeen asset
market loves this stock
up 250% in 18 months
at res now...but supp held and we watch that latest breakout column to retrace to get a potential 3 box vertical count
55nlns.gif
 
Top