Best Thread learning to read price action with p/f charts

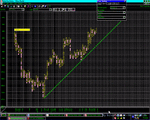
dollar index 30 min data
shows the trends since mid november
supports since fiscal cliff / fomc in green

2h3d3f8.gif
 
80.25 area hit
the aqua line is at 79.90
so we need to stay above 80 ish
otherwise we got a fake dollar rally
keep an eye on that downtrend on dxy in case it turns upwards
 
great stuff
keep em comin

dentist, have a few questions for you..its regarding Bulls Eye
1) I've attached the S&P daily data 15x3 going back some years. I fit it nicely on my chart. If you did the same in Bullseye, would you be able to view this in the same way, or would you be having to scroll up and down to get to all the history?
2) Can you do %ge box sizes in BE?
3) Is there a target (auto) function in BE?

Cheers mate
 

Attachments

  • S&P daily 15x3.jpg
    S&P daily 15x3.jpg
    1.1 MB · Views: 235
hi malaguti
s&p 500 futures
data goes back to may 2008 on the daily
here is 15 by 3 /close
 

Attachments

  • weekly trends004.gif
    weekly trends004.gif
    170.4 KB · Views: 195
answers to questions
1.yes...you can adjust box dimensions
2.% box sizes....yes
3 .no vertical counts or risk/reward...........but you should be able to pick those off by now by eyeballing
bullseye cost me under £100..one off payment.....data is free if you know where to look for it and set it up
streaming data...into bullseye...costs another $90 one off....but at this point can only stream 1000 data points from metatrader4.That programme was put in by Andy Skinner in Nebraska.That,i think can be adjusted.but to me that is not important.Do not fill the chart with loads..imho
 
dow futures
1 min data
trend that started from 31st dec
note how we have 2 trends to follow
the main trend in greens
the internal/ light blue...so....dont need too much backfill
each trend ...the main and the internal, has its own range volatility so must be looked at with slightly different box size and reversal..imho
dont crowd the chart and try to make one box size fit all...you have heard me rant and rave about that many times
2mn3t6x.gif
 
answers to questions
1.yes...you can adjust box dimensions
2.% box sizes....yes
3 .no vertical counts or risk/reward...........but you should be able to pick those off by now by eyeballing
bullseye cost me under £100..one off payment.....data is free if you know where to look for it and set it up
streaming data...into bullseye...costs another $90 one off....but at this point can only stream 1000 data points from metatrader4.That programme was put in by Andy Skinner in Nebraska.That,i think can be adjusted.but to me that is not important.Do not fill the chart with loads..imho

perfect, cheers mate
 
forgot to mention that bullseye is windows..however,you can run ur mac in windows mode..i think
metatrader ..i think is available for a mac
 
I've got something else for you mate..algo price preditions on the dow, I'll send it over by PM :clap:
thnks...but not got it yet
btw..you can still use updata charting,but you can unsubscribe from their data..then use metatrader data input...not sure if you have to adjust it for each time input..they charge £50 a month plus vat to rent the charts only
anyway...dow futures 5 min data
as point and figure traders,this is the only type of chart we really need..we are following this uptrend that began on 31st december
green is main trend
other colours are internal
iodx7t.gif
 
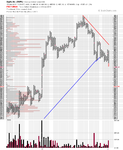
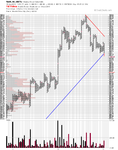
AAPL has now broken the long term P&F trend line on the 1% by 3 reversal chart as well as the traditional setting. See attached. Next major volume resistance comes in below 400.
 

Attachments

  • SharpChartv05-2.png
    SharpChartv05-2.png
    52.7 KB · Views: 204
  • SharpChartv05-1.png
    SharpChartv05-1.png
    59 KB · Views: 199
Hi Isa
happy new year to you
a healthy and profitable one

yes...agree on aapl
but.....
i feel it is better to track the downtrend
why....
if you are tracking the breakdown of the uptrend....then all you get is a series of levels and a longer wait for a signal..imho
mind you..if you fiddle around then either way works..but you need alot more backfill to track the uptrend on a shorter time input...imho
my chart
4 hour data
tracks the downtrend from 18 september
you can see clearly that it is divided into 2 waves of selling
1 red line bearish res line
2.purple line
$5 box size by 2 reversal hilo
if it is a bottom..that res line/purple is sitting in the $520 area
just my 2 cents

25yx5ol.gif
 
Hi Isa
happy new year to you
a healthy and profitable one

yes...agree on aapl
but.....
i feel it is better to track the downtrend
why....
if you are tracking the breakdown of the uptrend....then all you get is a series of levels and a longer wait for a signal..imho
mind you..if you fiddle around then either way works..but you need alot more backfill to track the uptrend on a shorter time input...imho
my chart
4 hour data
tracks the downtrend from 18 september
you can see clearly that it is divided into 2 waves of selling
1 red line bearish res line
2.purple line
$5 box size by 2 reversal hilo
if it is a bottom..that res line/purple is sitting in the $520 area
just my 2 cents

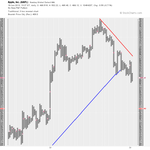
I think that's because you're much more short term oriented than I am. I started tracking the emerging short term downtrend here: http://www.trade2win.com/boards/technical-analysis/86964-learning-read-price-action-p-f-charts-49.html#post1986536 on 10th October and posted follow ups as it progressed. The point of the last post was just to show that the short term downtrend has now become the major trend as the uptrend line that began in early 2009 has been broken. So from a long term perspective that's significant imo, but short term it could have a rebound as it has come a long way already in short time. However, the major trend is now down and comes in around the 570 level on a traditional chart scale.

attachment.php
 

Attachments

  • SharpChartv05-5.png
    SharpChartv05-5.png
    43.3 KB · Views: 641
eurusd 4 hour data
14 pips by 2 reversal
shows the uptrend that started on 12 november
minor supp/aqua line
major supp for thsi uptrend is green
currently sitting at 1.3200 area
at res now
see how it plays out
358x53b.gif
 
Top