isatrader
Senior member
- Messages
- 2,964
- Likes
- 135
thanks isa
not really happy with % box sizes
are they log box or fixed
log really only for scanning..imho
thanks isa
4.breadth...X column % and bullish trend %..these might be useful and give a better picture than bullish %
hey isa
i want to know what youre breadth charts picked for last fridayto this monday.when stock index reversed that minor downtrend
are they sensitive enough to pick that up ??
which one worked the best ??

Duplessis book...new edition
if anybody has read it,then could they enlighten us on
1. two new techniques on drawing p/f charts...the low/high method and ohlc method.please let us know how they are constructed,so we can judge their usefulness
2.new chapter on analysis and choosing box sizes.this was badly explained in the first edition
3.gaps..implications of showing them..does it give more info on the columns ?? yes that is very useful,especially for stocks
4.breadth...X column % and bullish trend %..these might be useful and give a better picture than bullish %
5.horizontal activity histogram...this is price/volume for each box level..another useful indecator similar to market profile

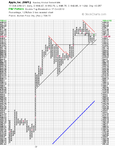
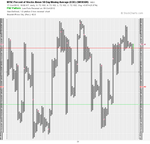
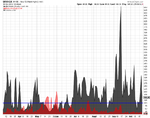
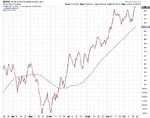
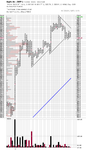
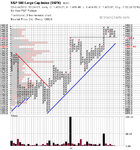
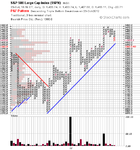
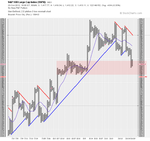
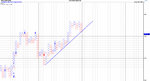
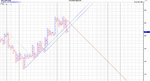
Hi dentist, here's a Daily S&P 500 chart 10 box by 3 reversal and a 60 minute chart 2 box by 3 reversal. I highlighted the support zone from the August range on the 60 minute chart. Daily chart is approaching it's one year up trendline and horizontal volume support at 1400 box.


Hi Isa, I'm curious, do you use the moving averages at all in conjunction with P&F? Other than having them on your charts. Does it help "confirm" anything, and if so, how?
Just out of curiosity, nothing sinister

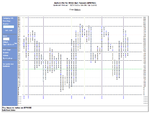
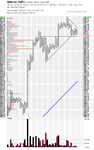
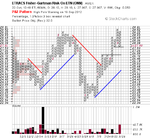
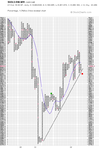
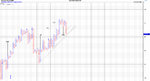
I do use them, but mostly on relative performance charts as I find they help to give breakdowns or breakouts more significance in the similar way that trend lines do. For example attached is the Gold/Silver ratio which has been in favour of owning Gold over Silver since June 2011. I say this because it made a swing high above the falling MA in May 2011 and then broke above that swing high in June 2011. So that was the buy point using the MA imo and even though it fell back below it, it didn't break the swing low that it formed and then broke out in earnest in August 2011 and started making successive higher highs.
If you look at the chart now it made a swing low below the MA in September 2012 and reversed to Xs. The MA has gone flat and so it would need to reverse back to Os and make a double bottom breakdown below the swing low which I've highlighted for the major trend to have changed in favour of owning Silver over Gold imo.
Does that make sense?