Best Thread learning to read price action with p/f charts

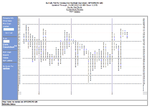
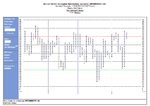
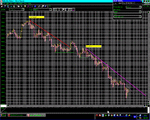
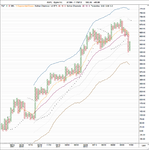
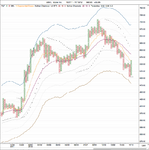
Here's the UK Bullish Percents for the Consumer Cyclicals sector and and Consumer Non Cyclicals Sector which covers the majority of the stocks you mentioned.

Consumer Cyclicals - Bear Confirmed in Os (breakdown from above 70% high risk zone)
Consumer Non Cyclicals - Bear Alert in Os (reversal from above 70% high risk zone)

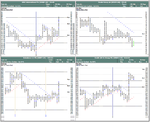
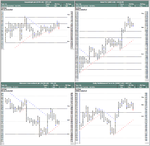
Also attached is the individual stocks listed for each with their P&F signal and relative strength.
 

Attachments

  • BPCONCYC-LN_8-11-12.png
    BPCONCYC-LN_8-11-12.png
    24 KB · Views: 228
  • BPCONNCYC-LN_8-11-12.png
    BPCONNCYC-LN_8-11-12.png
    24.1 KB · Views: 273
  • Consumer-Cyclical.png
    Consumer-Cyclical.png
    182.4 KB · Views: 225
  • Consumer-Non-Cyclical.png
    Consumer-Non-Cyclical.png
    96.4 KB · Views: 369
Last edited:
article in the telegraph a couple of days ago
new regs say that that any short positions above 0.2% of market cap must be published
hedge funds now have big short positions in
whsmith
home retail
ocado
sainsbury
tesco
dixons
also are carpetright,asos,glencore,and dmgt
they are expecting blood on the high street at xmas

now there are plenty of stupid people in this world...so lets see if we can beat the pros !!
hopefully,we can all post some charts and see if their strat makes sense

I knocked up a temporary portfolio on DWA of the stocks. See attached.
 

Attachments

  • DWA-Portfolios.png
    DWA-Portfolios.png
    92.3 KB · Views: 274
  • DWA-Portfolios_3.png
    DWA-Portfolios_3.png
    48.6 KB · Views: 249
  • DWA-Portfolios_1.png
    DWA-Portfolios_1.png
    26.7 KB · Views: 274
  • DWA-Portfolios_2.png
    DWA-Portfolios_2.png
    50 KB · Views: 256
Last edited:
sorting out the clever ones from the idiots
in my mind,thinking that we should look at trend on 0.5% box size or equiv arithmetic..with 1 ,2 and 3 reversal.
we want to define the medium term trend...weeks/months
the clever ones will be in stocks that are already in downtrend or about to breakdown
the idiots will be hoping that price will suddenly breakdown..possibly some news..ie fiscal cliff
so first of all ..we want to sort out who the idiots are ??


in my mind
 
one of the clever ones...i think
jim chanos a fantastic operator in my opinion.he exposed Sotheby"s,the auction house in a bbc 4 programme some time ago.they lent money to bidders to ramp up the price of some of the artworks....allegedly
he is short asos
35p by 2 reversal/close
in an uptrend from december 2011..at resistance and turned down slightly...showing supp now at 2200 area.major supp area in 1850
looks as though we might get some action down to major supp.
he will have done his research and seen something wrong in the balance sheet...i think
lets see what happens
9riq12.gif
 
one of the clever ones...i think
jim chanos a fantastic operator in my opinion.he exposed Sotheby"s,the auction house in a bbc 4 programme some time ago.they lent money to bidders to ramp up the price of some of the artworks....allegedly
he is short asos
35p by 2 reversal/close
in an uptrend from december 2011..at resistance and turned down slightly...showing supp now at 2200 area.major supp area in 1850
looks as though we might get some action down to major supp.
he will have done his research and seen something wrong in the balance sheet...i think
lets see what happens

has dropped 70 points already..your data might be old..good call though
 

Attachments

  • ASOS PLC ORD 3.5P.jpg
    ASOS PLC ORD 3.5P.jpg
    1.1 MB · Views: 206
malaguti..thnks
asos had a big drop on friday.data was downloaded on thursday
a betteer chart for examining the hedge fund short position
daily data 60p box size by 1 reversal
we can see trend support at 2040 area/green line..lets say 20 quid,round number
breakout point at 1850 area/red,horizontal
and a horizontal count that is 1850 area,as well as vert count put on by malaguti
price is at 2200 area supp and could break that triple bottom/semi catapult..then on down to 2050 area
so now we need to track that downtrend that started on 18 october
malaguti,,if you could put on a chart.say 15 min /close that tracks just that downtrend and also an rs chart against the ftse 100 that tracks from say 10 october
imho
then we can get an opinion on how deep the doo-doo is on this stock

54d35s.gif
 
malaguti..thnks
asos had a big drop on friday.data was downloaded on thursday
a betteer chart for examining the hedge fund short position
daily data 60p box size by 1 reversal
we can see trend support at 2040 area/green line..lets say 20 quid,round number
breakout point at 1850 area/red,horizontal
and a horizontal count that is 1850 area,as well as vert count put on by malaguti
price is at 2200 area supp and could break that triple bottom/semi catapult..then on down to 2050 area
so now we need to track that downtrend that started on 18 october
malaguti,,if you could put on a chart.say 15 min /close that tracks just that downtrend and also an rs chart against the ftse 100 that tracks from say 10 october
imho
then we can get an opinion on how deep the doo-doo is on this stock

here's a 15min 10x2 and RS
 

Attachments

  • ASOS ORD 3.5P.jpg
    ASOS ORD 3.5P.jpg
    1.3 MB · Views: 261
  • ASOS RS.jpg
    ASOS RS.jpg
    1.4 MB · Views: 245
spx
30 min data
shows the downtrend that started this month
resistance lines are marked
k6kvs.gif
 
malaguti
a great call on mks
knickers definitely got twisted at 400p
asos..long from the bounce zone goin well..a strong stock since spx tanked
spx...any rally needs to take out this trendline
10 min data
smf3ly.gif
 
Last edited:
aapl 60 min data
showing the many phases of the downtrend that started on 20 september
$2.00 box size by 1 reversal
any rally must take out those resistance lines
 

Attachments

  • weekly trends003.gif
    weekly trends003.gif
    91.5 KB · Views: 169
fly me to the moon
let me sing among the stars
let me know what life is like on jupiter and mars
in other words...
aapl 3 min
96wawi.gif
 
A different look at AAPL. Custom 10 box by 3 reversal with Keltner Channels (22 column with 3 ATR settings) and an 11 column MA, plus parabolics. Also a 5 box by 3 reversal with the same settings.
 

Attachments

  • AAPL_PnF_20_11_12.png
    AAPL_PnF_20_11_12.png
    44.4 KB · Views: 240
  • AAPL_PnF_5box_20_11_12.png
    AAPL_PnF_5box_20_11_12.png
    47.6 KB · Views: 229
spx 5 minute
shows the latest uptrend that started on 16 november
supp areas /45 deg trendlines are 1394 and 1387 areas
rbmtxt.gif
 
Top