M
You are using an out of date browser. It may not display this or other websites correctly.
You should upgrade or use an alternative browser.
You should upgrade or use an alternative browser.
Best Thread learning to read price action with p/f charts
- Thread starter Dentalfloss
- Start date
- Watchers 60
Dentalfloss
Legendary member
- Messages
- 63,404
- Likes
- 3,726
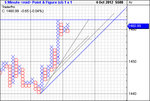
ok,,u got itTracking the latest breakout here...
those trendlines are right on the chart
so..scalp long until a break..thats all you can do
Dentalfloss
Legendary member
- Messages
- 63,404
- Likes
- 3,726
Dentalfloss
Legendary member
- Messages
- 63,404
- Likes
- 3,726
a better chart of the spx
4 hour data
2 trendline cluster areas...if it breaks down
1.1440 area
2.1420 area
lets see if the res area holds

4 hour data
2 trendline cluster areas...if it breaks down
1.1440 area
2.1420 area
lets see if the res area holds
Dentalfloss
Legendary member
- Messages
- 63,404
- Likes
- 3,726
eurusd 30 min data
10 pips by 1 reversal.close plot
trend that started on 30 sept
let"s see if it holds

10 pips by 1 reversal.close plot
trend that started on 30 sept
let"s see if it holds
isatrader
Senior member
- Messages
- 2,964
- Likes
- 135
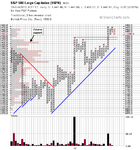
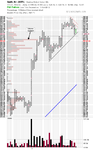
There's potential for a shakeout pattern on the S&P 500 with horizontal price supports one and two boxes below the double bottom breakdown level below 1430.
The closest largest volume support level is in the 1400 to 1410 range, so any break below 1400 would be more significant imo.
10pts by 3 box reversal plot

The closest largest volume support level is in the 1400 to 1410 range, so any break below 1400 would be more significant imo.
10pts by 3 box reversal plot
Attachments
Dentalfloss
Legendary member
- Messages
- 63,404
- Likes
- 3,726
eurusd..update to that 30 min chart posted yesterday
.we wondered if that uptrend could hold
it did not,and we got a good signal to go short at the break of the trendline
horizontal red line

.we wondered if that uptrend could hold
it did not,and we got a good signal to go short at the break of the trendline
horizontal red line
isatrader
Senior member
- Messages
- 2,964
- Likes
- 135
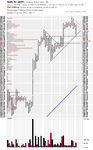
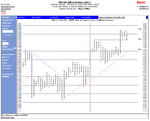
Good stuff dentist on the EUR/USD. Here's a percentage chart of Apple. 1% box size by 3 box reversal with the short term trend lines added. It rebounded from the trendline today but needs to get above 645 to go back to Xs. Be interested to see one of your 1 box charts dentist as I think Apple is an important driver for the broad market direction.

Attachments
Last edited:
Dentalfloss
Legendary member
- Messages
- 63,404
- Likes
- 3,726
ao now we track that downtrend
box sizes do have to be adjusted as each trend has its own range volatility
7 pip reversal in this case seemed to show the best bits of information
note how the fierce downtrend/red line has ended and price has retraced into resistance
a possible new uptrend in the making
lets see what happens

box sizes do have to be adjusted as each trend has its own range volatility
7 pip reversal in this case seemed to show the best bits of information
note how the fierce downtrend/red line has ended and price has retraced into resistance
a possible new uptrend in the making
lets see what happens
Dentalfloss
Legendary member
- Messages
- 63,404
- Likes
- 3,726
aapl 30 mins data
tracking the downtrend from $700 area
$2.00 box size by 1 reversal

tracking the downtrend from $700 area
$2.00 box size by 1 reversal
isatrader
Senior member
- Messages
- 2,964
- Likes
- 135
aapl 30 mins data
tracking the downtrend from $700 area
$2.00 box size by 1 reversal
Thanks. The short term downtrend lines are very similar to the percentage chart positions. But that low pole reversal yesterday on your 1 box chart gives a good view of the intra-day price action.
Dentalfloss
Legendary member
- Messages
- 63,404
- Likes
- 3,726
low pole reversal
yes...could be
you see quite a few of them /intraday
seems to be the main aim....think that market makers drop the price to test the support
thinking that the real test is $650 res area
now you have the supp area $625 ish and the overhead res. $650 ..easy now to track the price
both areas look reasonably important
Dentalfloss
Legendary member
- Messages
- 63,404
- Likes
- 3,726
spx 15 min data
downtrend is still in play from the 1470 top
looks to want to make another pop at resistance
lets see what happens

downtrend is still in play from the 1470 top
looks to want to make another pop at resistance
lets see what happens
Lax_Van_Dumb
Member
- Messages
- 63
- Likes
- 5
I agree
Dentalfloss
Legendary member
- Messages
- 63,404
- Likes
- 3,726
lex...good to have you onboard
isa..a better chart of aapl
aapl 4 hour data
$5 box size by 2 reversal
close plot
it does not seem to have really tested the $620 area support/green line
the 50% of the low pole is 650
but....look at those red lines
coming in at $660 and $670
thinking that we really need to test support and see if the bulls are still there
lets see what happens
isatrader
Senior member
- Messages
- 2,964
- Likes
- 135
isa..a better chart of aapl
aapl 4 hour data
$5 box size by 2 reversal
close plot
it does not seem to have really tested the $620 area support/green line
the 50% of the low pole is 650
but....look at those red lines
coming in at $660 and $670
thinking that we really need to test support and see if the bulls are still there
lets see what happens
That 620 support looks fairly key on both your's and my percentage chart. But note the volume support and price objective are both around the 600 level, so it could drop through the trendlines and still find a base not much further down.
The low pole reversal reached the double bottom breakdown level, but is close to reversing to Os and making a continuation move lower if it gets below that 620 level.
1% box size by 3 reversal with high/low plot
Attachments
Dentalfloss
Legendary member
- Messages
- 63,404
- Likes
- 3,726
as we said yesterday
spx
another pop at resistance and then the move down chart to follow
spx
another pop at resistance and then the move down chart to follow
Dentalfloss
Legendary member
- Messages
- 63,404
- Likes
- 3,726
spx 1 min data showing the pop at resistance
thursday"s support was marked...pink horizontal line
we were ready on friday when price took a pop at res.
then shorts in

thursday"s support was marked...pink horizontal line
we were ready on friday when price took a pop at res.
then shorts in
Dentalfloss
Legendary member
- Messages
- 63,404
- Likes
- 3,726
spx 5 min data
watching that downtrend that began on 5th october
if it recoils then we watch 1432 area to see if we that downtrend can be broken
if it goes lower so will the res area

watching that downtrend that began on 5th october
if it recoils then we watch 1432 area to see if we that downtrend can be broken
if it goes lower so will the res area
isatrader
Senior member
- Messages
- 2,964
- Likes
- 135
Similar threads
- Replies
- 34
- Views
- 10K