Dentalfloss
Legendary member
- Messages
- 63,404
- Likes
- 3,726
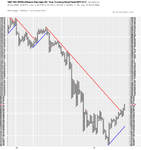
spx 5 min data
a very intensse uptrend
these cannot be maintained for long

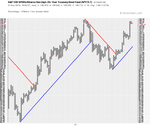
a very intensse uptrend
these cannot be maintained for long


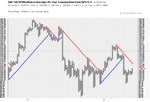
thanks isa...good chart
u need to track that latest uptrend with some lines..for strength and weakness
plot the above resistances and see the reaction at those if it carries on moving up
better still.....if malaguti could post the same chart....but normalised relative strength....same box size 1% close with a look back period to say aug 2010
normalised rs cannot be plotted on stockcharts...but gives a better picture imho