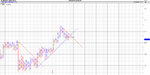
BT..yes,a new downtrend.......BUT......
go up box sizes
and see where the trends are and where they break
these are potential supp levels
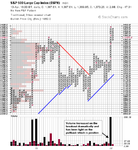
OK, so looking at a 3 box size, I can indeed see we have support underneath.
So should these be my potential exit and reentry points? on the break of these?
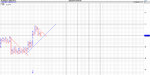
most breaks,you usually get 5 boxes...then market retraces..that is a rule from holygrail on elitetrader...a good one
so in the region of 5 box i am lookin for an exit potential..i dont want to be around whilst the market decides
but then i am looking at retracement areas for early entry...see Duplessis book for that
Thats very interesting, visually even looking at BT 4-5 boxes and then a retracement. So clearly you are not looking for confirmation of the breakout, as then you only have 2 boxes perhaps from which to exit, and not even setting a sell stop on the break as you are already in..too advanced for me, but I will take this on board!