Best Thread learning to read price action with p/f charts

hi malaguti
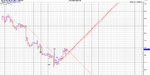
i got myeself some 10 minute data for barc
not an easy one
in fact it tricked chartcraft into going long
here is the chart
showing the downtrends
the first one was a short one and sudden
the second one is far more tradeable...the red line
you can see how many consecutive p/f signals there were on the second downtrend
so,we keep the red line as the trend identifier....any move to the line and we close any shorts.that shows.the trend is weakening

2w2qxyg.gif

also,to make life more intolerable,there was a long period of consolidation between first move down and second move
 
Last edited:
barc...hourly data
the green line shows where chartcraft/investors intelligence got caught in a trap/shakeout
they got a signal to go long
they made the classic mistake..they traded against the trend..see that downtrend line/red
the numbers are just dates...daily
 
Last edited:
here is an excellent chart for defining the trend
45 degree trendlines are red
subjective is purple
60 min
audusd

3y2z4.jpg
 
Gold this is happening right now
I was viewing this on a 1box reversal, this is 2 however for any fresh upward counts. That according to duplessis was not a good sign.
But I'd like to trade the breakout as its all good experience
 

Attachments

  • GOLD 2x2 cl.jpg
    GOLD 2x2 cl.jpg
    1.3 MB · Views: 321
hi malaguti
here is 10 min data for gold
can it maintain that trend ??
it is not too steep
if not,we must look for a support at a lower level
 
spx hourly
still no let up in that downtrend
internal trendline has to be taken out to show some sign of strength

1jq1cy.gif
 
hi malaguti
here is 10 min data for gold
can it maintain that trend ??
it is not too steep
if not,we must look for a support at a lower level

Thanks Dentist..I find it very difficult to read 1box reversal, 2 is the best I can hope for at the moment. I'm seeing the relationship now between high low and close charts which is good news. I've switched to intraday for the time being. What I learn from looking at a 1 min setting saves months of looking at end of day
And thanks for those barclays charts, I closed out when there was a hint of a buy, but didnt of course take the trade but I may well play with running the trend as long as possible until internal targets have been reached.
I'll put in your settings for S&P. There will be a break for sure and I'd like to see some of that action

John
 
facebook ipo came at the worst possible time
here is the spx..1o min data
the downtrend from 1 st may
note that it is in 2 waves
the first was a sudden move
the second is more prolonged and will have to take out that downtrend line with a res area of 1307 ish.if price goes down,so does the res area

 
EURUSD 60 min data
watch for that res area to get taken out


cable/prev chart is 10 min data
these areas must be taken out if any dollar weakness to show
 
cable
gbpusd
10 min data
3 downtrend waves.the last one may not be complete
eyes on that res area at 1.5540 for non farm payrolls on friday
that res area will move down if price continues down
dmw7iv.jpg
 
europe watch
dax
daily data
no reason to go long as yet
there will be bounces
need to see that downtrend line taken out.if there is a reaction point.ie a correction of this down move we can draw another internal trendline that gets nearer the price action
2vamcyb.gif
 
hi malaguti
that was a 60 min data
what you look for..
that last down move had just started on friday.the long column down was the gap down befoire the the open from nfp numbers
so theis move should be really tracked say on 1 or 5 minute..with the 60 min medium term trend in the background
only draw trendlines from the 1st may high..that gives you the longer term trend
we want to track this latest move downwards..we will have a few trends on that shorter t/f charts and we can then see which ones hold
remember.. we are not calling out levels where support comes in....we are tracking those trends with trendlines...p/f trendlines track constant rate of change per reversal...barchart trendlines track constant rate of change per unit of time
we want to track the price action and trade from called out levels
from called out levels ,we only have an idea where s/r should lie.does not mean that the trend will change
 
update to that hourly spx chart
we had a reaction point .so now we can place more trendlines nearer the price action.these are the green trendlines.there is the more inetnse downtrend by the first downtrend line.this was drawn connecting the right hand side of the semi=catapult.this is a very intense trend and probably will weaken.the other is the 45 degree trend..the thicker green line

 
Top