Learning profitable automated trading

lol says on the repotrt, 7 years!! for 90% roi

12% return per year...yeh great system

and why u backtestig it up to 2008? lol..lets see it up to 2010 thanks, bet its ****

i think this proves you are full or **** and a fraud.

Add 4 different systems with different equity curves, and we have a great combination of systems producing 50% per annum.

I don't back test after 2008, due to lack of data and most brokers switching to 5 digits,but use forward tests and live accounts for testing and trading.

http://www.alpari.co.uk/en/dc/databank.html

Your posts prove only one thing , who is full of it and whose the fraud trying to lure noobs ?.
 
lack of data after 2008? what have you been smoking. the only reason your not testing it after 2008 is because the markets changed and prolly blew your system to pieces. scam alert
 
how conviniant. get the data from somewhere else and lets see your results. and who the hell is "we" ?
 
how conviniant. get the data from somewhere else and lets see your results. and who the hell is "we" ?

We is referring to traders using metatrader.

Can get old data on the net ,but very little data after 2009.I suspect the bucket shops got worried about lawsuits on their fills ,stop hunting and spread widening.
 
i am testing a Robot, How can i have only MANUAL alerts and NOT live trading?
If i uncheck ALLLOW live trading then it stops working
I have checked Ask for manual confirmation,
The system keeps beeping unless i trade and it is irritating me > if I trade then it stops beeping, but dont want to trade all > any way out?

HELP

Run it on demo account only.

Don't check ask for manual confirmation , it will trade auto without asking confirmation
 
The learning expert advisors in this thread produced the following results , using my knowledge in the versions I use.These are just 7 out of 100 expert advisors I use.
 

Attachments

  • combined 7 data july 1 2003 to 2008 chart.xls
    117.5 KB · Views: 306
Automating can be complicated .

I have are 4 breakout systems which will buy when price is on the up , with buy stop orders/sell stop orders , all work on different parameters.There are s/r systems and contrarian systems buying against the market direction, after a exhausted trend,several different t/f reversal systems on trend line reentries ,several systems based on cci, stochastics and custom contrarian indicators,momentum systems,trend breakout failure systems etc.There are swing systems using a special exit indicator.There are other breakout swing systems and intraday breakout systems.

O D T
 
There is a big problem designing automated strategies for USD/YEN and USD /CAD .These pairs not very volatile, some of the volatility happens at night time.The Japanese and Canadian economy is correlated to the U S , hence lower volatility.The Euro zone pairs trend better against the USD.

Any suggestion on strategies to automate the USD cad and Usd yen?.I have tried almost 50 strategies on these pairs without success.
 
The equity curve below is of the automated system I use for my own trading.It was updated yesterday.
134,311 pips over 7 .5 years of back testing , an average of 17,908 per annum on a 20,000 account.
This equates to an average 88% per annum from 2001 to mid 2008.

Already part of the above strategy is on live trading.

I really do not have to trade manually , when there are 2 computers doing the work for me , 24 hours a day with all the headaches of traders.
 

Attachments

  • equity curve.jpg
    equity curve.jpg
    41.4 KB · Views: 274
This looks impressive, but I have a few questions.

1. How many trades does this entail, and have you included bid/ask/commission/slippage etc.
2. Have you simply divided total return by number of years? If so, that overstates the CAGR.
3. How has it performed since mid-2008, when volatility reached a peak?
 
mean revision its not impressive at all. he is back testing up to 2008, you really think these systems would stand up to todays market? no chance.

any system can be tweaked to create returns from back testing, doesnt mean they work.

i dare ODT to post up actually live trading data with proof, trouble is, it doesnt exist.
 
check it! just made my own system thats wipes the floor with odt..took all of 5mins!

back tested over a year

7 winning trades, no losses, 120% over a year..wow holy grail...oh no wait i kept adjusting it till it gave me the print out i wanted. shame it doesn't actually work
 

Attachments

  • EURJPY.jpg
    EURJPY.jpg
    93.1 KB · Views: 248
This looks impressive, but I have a few questions.

1. How many trades does this entail, and have you included bid/ask/commission/slippage etc.
2. Have you simply divided total return by number of years? If so, that overstates the CAGR.
3. How has it performed since mid-2008, when volatility reached a peak?

1 .16344 trades ,profit 133,411 = 8.16 pips per trade after allowing 1 pip slippage, 1 pip sound realistic.2133 trades per annum , using 32 systems = 66 trades average per system , per annum.Average one trade every 4 days.

2..Yes total return is divided by number of years.If compounding is applied to profits reused for bigger positions in a sensible way , returns would actually be estimated 300 % per annum.

3.After July 2008 the data supplier discontinued supplying data. in particular data on cable was discontinued much earlier.Volatility in pips decreased after sept 2008 and any other increase in volatility would be beneficial to the above systems, they trade wide stops and higher profits.

The worst years for trading these systems were 2,002, 2005 and 2007 i.e patches of low volatility.They do very well in high volatility periods.

O D T
 
mean revision its not impressive at all. he is back testing up to 2008, you really think these systems would stand up to todays market? no chance.

any system can be tweaked to create returns from back testing, doesnt mean they work.

Systems designed by morons optimise on historical data, systems designed by traders to trade their own money look for a robust system to stand the test of time.
 
check it! just made my own system thats wipes the floor with odt..took all of 5mins!

back tested over a year

7 winning trades, no losses, 120% over a year..wow holy grail...oh no wait i kept adjusting it till it gave me the print out i wanted. shame it doesn't actually work


7 trades ,you really are a 14 year old in a man's world.Please grow up.

Put it on test through the most difficult trading years and then post.
 
"Put it on test through the most difficult trading years and then post. "

says the man who doesn't back test past 2008, Jesus you crack me up. how anyone can take this guy seriously is beyond me.

im gona publish a book of all your "shoot myself in the foot" posts i think
 
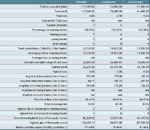
Here are the trades to calculate sortino , sharp and other dd ratios.
 

Attachments

  • currencies.xlsx
    459.9 KB · Views: 244
Top