Leading Indicators as Opposed to Lagging Indicators

dbphoenix said:
There are many things that reportedly "work" for someone or someones or other, but which fail to measure up when tested. And there are many things that seem to "work", but when examined more closely are found to work for reasons other than those which are suggested. Spring comes, after all, whether one tosses the virgin into the volcano or not.

This business of dropping off old numbers is used in a number of applications, such as some calculations of the AD line. But, eventually, one arrives at a So What? Like taking your age and multiplying it and dividing it and adding and subtracting and including the loose change in your pocket and adding 115, it's easier just to remember how old you are and to count your change.
All well and good, whatever, but what has that to do with Moving Averages or Leading/Lagging Indicators?
 
TheBramble said:
All well and good, whatever, but what has that to do with Moving Averages or Leading/Lagging Indicators?

It has to do with what I quoted.
 
TheBramble said:
If you're adding (or probably about to add) bigger numbers to a set which is being averaged than those that are being dropped, your average is going to go up.
I follow that entirely, Brambly One, but in my mind there's possibly some circularity in Goslin's argument, because it seems to me that he's inferring that the price will go up because the average goes up, whereas in reality the average will only go up because (if) the price has gone up. However, it's late and I'm more tired than usual and I concede that I may not be doing him justice, and I may not be doing you justice, and I may not even be doing DB justice (but he's probably used to that).
 
Mr Charts

Stochastics sometimes lead price - but not as used by most people ;-)))

Salty Gibbon

I know that this is a very old post Richard but could you possibly elaborate and give some explanation as to under what conditions Stochastics can lead price.

FC

perhaps he is referring to divergance?? possibly the best/only way to use conventional indicators..

Yes, I think you are probably correct FC. Been looking at this and I think it is almost certainly to do with divergence.
 
Salty Gibbon said:
I know that this is a very old post Richard but could you possibly elaborate and give some explanation as to under what conditions Stochastics can lead price.

I know that Stochastics can give the impression of giving a good signal but it is all in the mind.
Stochastics are built out of historical data and there is no way that they are going to lead anything. Anyone who tends to be led by them is heading for a fall. In my opinion, that goes for all indicators and patterns.

Split
 
I must say that of all the indicators I've ever played around with (in my recidivistic youth, you understand, although I still do, sometimes ... but not usually in public ...) stochastics were the ones I liked and understood least, and the ones I found least "reliable" of all. Maybe just because I didn't really know how to try to use them and wasn't sufficiently interested in finding out; but they always seemed to me to be excessively "sensitive" ...
 
Splitlink said:
I know that Stochastics can give the impression of giving a good signal but it is all in the mind.
All indicators are 'just' in the mind. The good part is - they're in A LOT of peoples' minds...


Splitlink said:
Stochastics are built out of historical data and there is no way that they are going to lead anything
I Agree. All indicators are built on historical data and no indicator in and of itself will 'lead' to anything other than someone or an automated system making a decision.

However, if you're going to persist with the blighters, stochastics are pretty neat. But they have to be used within the 'context' of the current trend. Using them purely for overbought/oversold wont be much better than a coin toss most of the time.

Just for 'fun', play around with stochastics (doesn't matter too much what values you choose) and set horizontal lines at 20 and 80.

Look what happens when the Stoch moves from below the 20 to above it AND the price is in an uptrend for that timeframe (simple 5MA will do for that).

Similarly when the Stoch moves from above the 80 line to below it AND the price is in a down trend for that timeframe.

I wouldn't trade JUST that setup, but you can see it provides a lot of support for whatever else you're using - most of the time.
 
I also find Stochastics a neat indicator and helps me, as a final tool, to confirm a trade entry when everything else I look at is all pointing in the same direction.

Something akin to what Joe Ross describes in a Traders magazine article on 123 formations last May-June where he uses a stochastic setting to time his trade entry more precisely ( and early ) after the chart pattern has set up.

My real reason for being on this thread was to try and find out under what conditions Mr Charts considers that stochastics can behave as a leading indicator.

Alas no response.
 
TheBramble said:
All indicators are 'just' in the mind. The good part is - they're in A LOT of peoples' minds...


I Agree. All indicators are built on historical data and no indicator in and of itself will 'lead' to anything other than someone or an automated system making a decision.

However, if you're going to persist with the blighters, stochastics are pretty neat. But they have to be used within the 'context' of the current trend. Using them purely for overbought/oversold wont be much better than a coin toss most of the time.

:) No, I'm not persisting. You're not persuading me! I've had my share of indicators and decided that the important stuff is mostly all in the price chart. Here's why.

I am not an intraday trader. I buy with the intention of staying with the trade for the run, if I can time it properly, but most of the time I get out too early. That's another story.

Because of my routine an EOD chart is good enough for me but an EOD stochastic giving a 80/20 signal is too late. It doesn't give me the overbought/oversold signal because it deals with closing prices. I've already figured out the PREVIOUS day what my entry price will be for that trade and it will be somewhere on today's bar. If not, I don't trade. So the guy that reads that Stochastic signal will be intending to get into the market a day later than me and he may get in when I am thinking of closing, if there is a good early morning move.PLEASE don't get the idea that I am a big head- my mistakes can be as big as anyone else's around here, believe me, but I think that a simple MA, just to get the idea of the trend is all I need.

One recent share that I caught like that on 2nd Feb was Reckitt (RB.) I was out of the market within the first hour with a 55 point gain. I was slow- there were better profits to made there than that, but the Stochastic would not have told me until that evening.

Split
 
To save all of you a lot of bother and a lot of unnecessary work, both leading and lagging indicators are nonsense. This is because in order for these things to function they have to operate on the basis of predetermined "rule sets". Incredible levels of effort, time, and money are devoted to developing these Holy Grails that cannot and do not work with any consistency.

Part of the reason for this is that the entire kaliedoscope of price development is so vast that no indicator can be devised to take account of all these variables and to put them into a program.But it is what people want, and so many software developers put all these gizmos into software both in an effort to please the customers and to keep up with other software developers also pleasing their customers, and so the insertion of indicators in programs is commercially driven, and not as people think they are driven.

This is a cruel misdirection of public attention but no amount of trying to draw the attention of the misguided has any effect whatsoever. So if they all want indicators, let them have indicators !

I am not willing to do it, by the way. This is why as a software owner with worldwide syndication rights, all my softwares are stripped of all this nonsense. This limits the market to very few discerning users who are the darkest of darksiders you can imagine, to whom even the mention of the word "Indicator" is an abhorrence. For this reason, my software is not available commercially either, as the opposite to "Indicators" is too valuable and powerful to be released wholesale into the public domain.

And there you have it.
 
i disagree Ottos..

by definition they are based on historical data.

and secondly, they give no "indication" as to whether the price will break through, or reverse on the trendline.
 
I can see your point ottos, as although they are drawn from historical prices they are then extended into future price, though I have to agree that I would not class them as an indicator either.
 
I don't class them as indicators either, and certainly not as "leading indicators", (if there's any such thing). But like so much else in discussions of this and related matters, it's really a semantic point, n'est-ce pas? Different people and especially different authors just mean different things by "indicators". Personally, I don't really have any confidence in any of them, but that's my problem.
 
ottos said:
Trendlines are leading indicators .

They will let you down when the trend reverses, as will most indicators. They can be fiddled, as well, for the best fit. Averages will let you down, too, when the trend turns but I do check one to give me an idea of the trend that I should be in. That is the only concession I make to indicators.

Split
 
Splitlink said:
They will let you down when the trend reverses, as will most indicators. They can be fiddled, as well, for the best fit. Averages will let you down, too, when the trend turns but I do check one to give me an idea of the trend that I should be in. That is the only concession I make to indicators.

Split

Hi Splitlink,
I find that a rather odd statement, as I don't quite understand what you mean by "let you down"
 
roguetrader said:
Hi Splitlink,
I find that a rather odd statement, as I don't quite understand what you mean by "let you down"

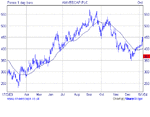
Averages are often used as trading signals when they are pierced. Sooner or later, though, the trend changes and traders must be on the alert for this. I don't use averages for trading but this thumbnail of AVZ may give a better idea of what I want to say. It is a 30 day and works well for the uptrend, not so well for the down. The problem is "What average must one use?" However, as I said before, an ma does illustrate the trend well, which is the only reason that I use one.
However, with an average line like this, who needs trendlines?

Split
 

Attachments

  • Dibujo.gif
    Dibujo.gif
    9.6 KB · Views: 361
Splitlink said:
Averages are often used as trading signals when they are pierced. Sooner or later, though, the trend changes and traders must be on the alert for this. I don't use averages for trading but this thumbnail of AVZ may give a better idea of what I want to say. It is a 30 day and works well for the uptrend, not so well for the down. The problem is "What average must one use?" However, as I said before, an ma does illustrate the trend well, which is the only reason that I use one.
However, with an average line like this, who needs trendlines?

Split

I can understand that, but it still doesn't explain how they "let you down" unless of course one is being assumptive and entering trades on the premise that they will bounce off a trendline. In order for something to "let you down" you have to depend on it to do something and then it not do it. People often get themselves into real trouble in the markets by assigning a dependancy to certain things, and then feeling "let down" when the expected behavior does not come about. It is often a good idea to work out what a particular tool can't do, ie its limitations before focusing too much on what it may be able to do. Just my thoughts.
 
You are asking the great majority to engage a faculty of which they are either not capable or not willing, to my sadness and dismay.
 
To all who were referring to my post about trendlines.

You are right if trendlines are used in traditional way, however after studying it and getting mentored about using them as leading indicator , I now believe that trendlines are the the best leading indicator I know about .
 
Top