journal of trader formally known as wasp

Status
Not open for further replies.
wasp said:
12 and 13

Thanks for that. I am sure the more experienced traders have their opinions, but if it helps, I find that a weighted 10 on a 5 min chart gives a very good entry target and stops me chasing the price.
 
wasp said:
currently up on Moday morning...

At the moment, not sure how far it may go but the bottom held up so looking for a move past 23 to move the stop up to breakeven.

Does your charting program allow you to post "volume" as a line?

Db
 
Now that would be telling!

Mind you, since you asked... Ericsson. ERICB.ST on the Stockholm exchange... wanted something small and slow to test myself on.
 
dbphoenix said:
Does your charting program allow you to post "volume" as a line?

Db


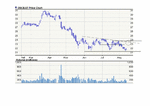
Like this? It is only via reuters website so very basic options...
 

Attachments

  • eric.gif
    eric.gif
    132.2 KB · Views: 294
wasp said:
Like this? It is only via reuters website so very basic options...

Not really. This is OBV (On Balance Volume). Can you plot a 1p (1 period) MA of volume? If this is a hassle, don't bother.

Db
 
No it doesn't offer it. Like I say, its only the very basic via reuters website.
 
Crawsthorne said:
Thanks for that. I am sure the more experienced traders have their opinions, but if it helps, I find that a weighted 10 on a 5 min chart gives a very good entry target and stops me chasing the price.

Whatever works for you and keeps your losses low and your profits high is what matters. :)
 
glad you picked something easy :rolleyes:

given my limited data, if I was trading it I would be looking for a gap up tomorrow at 2287 and take profit then wait for another entry
 
wasp said:
No it doesn't offer it. Like I say, its only the very basic via reuters website.

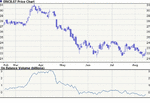
Well, let's try this, keeping in mind that OBV is an indicator and not a line representation of the actual volume.

When I became interested in Wyckoff, I began doing this for both price and volume as a means of focusing on the waves rather than being thrown off by micro-managing the minutiae of individual bars. Since you appear to have interpreted the character of this base correctly, you may be picking this up by osmosis (or you may be making a conscious effort at it).

Note here that when price makes its second trip down, volume (i.e., trading activity) is about the same or slightly lower. You know buyers are coming in because price rises (and rises nicely). You know sellers aren't especially eager to push price lower because trading activity is no higher than it had been the first try. When price makes its third trip down, its trough is higher, and so is the trading activity trough. This is consistent with an observation that buying pressure is outweighing selling pressure on two fronts: the level of trading activity and the movement of price.

When price makes its fourth and perhaps last attempt, it makes a lower trough, but so does volume, suggesting that sellers are truly done, at least for now. At this point, it's up to the buyers. Can they push price out of this range, or do they encounter further resistance at the top of the range? Nothing to do about that but stay tuned.

All of this is easier to see if you replace price with a 1p MA or with a line-on-close option. This enables you to see the price waves, if you want to, and better evaluate them with regard to the OBV plot. Just a suggestion, if you're going to continue to incorporate volume.

Db
 

Attachments

  • Image1.gif
    Image1.gif
    101.3 KB · Views: 364
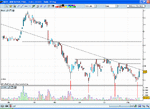
I'm in this for the long haul... I think it'll go much higher yet but I will trail the stop relatively tight in case.

My position is very small so the profit is not the point, its the study and analysis which is why I'm in it. I think a break above the downtrend line and a close above should put it into an uptrend... a possible pullback to the trendline then rebound and further north....

stops in place :devilish:
 

Attachments

  • LT view.gif
    LT view.gif
    93.2 KB · Views: 285
Last edited:
dbphoenix said:
Well, let's try this, keeping in mind that OBV is an indicator and not a line representation of the actual volume.

When I became interested in Wyckoff, I began doing this for both price and volume as a means of focusing on the waves rather than being thrown off by micro-managing the minutiae of individual bars. Since you appear to have interpreted the character of this base correctly, you may be picking this up by osmosis (or you may be making a conscious effort at it).

Note here that when price makes its second trip down, volume (i.e., trading activity) is about the same or slightly lower. You know buyers are coming in because price rises (and rises nicely). You know sellers aren't especially eager to push price lower because trading activity is no higher than it had been the first try. When price makes its third trip down, its trough is higher, and so is the trading activity trough. This is consistent with an observation that buying pressure is outweighing selling pressure on two fronts: the level of trading activity and the movement of price.

When price makes its fourth and perhaps last attempt, it makes a lower trough, but so does volume, suggesting that sellers are truly done, at least for now. At this point, it's up to the buyers. Can they push price out of this range, or do they encounter further resistance at the top of the range? Nothing to do about that but stay tuned.

All of this is easier to see if you replace price with a 1p MA or with a line-on-close option. This enables you to see the price waves, if you want to, and better evaluate them with regard to the OBV plot. Just a suggestion, if you're going to continue to incorporate volume.

Db

Cheers for that db,

If something comes off this I will endevaour to find and use a more comprehensive chart package which allows these options. At the moment its wherever I can find a chart!

Strangely saw the same outcome/analysis as you said but without the volume factor as its not something I really understand properly as yet.

For the meantime it is watch and wait and see how it reacts to the resistance levels as and when and if it moves higher...
 
dbphoenix said:
All of this is easier to see if you replace price with a 1p MA or with a line-on-close option. This enables you to see the price waves, if you want to, and better evaluate them with regard to the OBV plot. Just a suggestion, if you're going to continue to incorporate volume.

Db
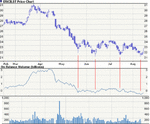
Like this, more or less. The point, of course, is knowing when best to enter.
 

Attachments

  • Image1.gif
    Image1.gif
    47.3 KB · Views: 308
wasp said:
Cheers for that db,

If something comes off this I will endevaour to find and use a more comprehensive chart package which allows these options. At the moment its wherever I can find a chart!

Don't overspend. When I began looking at PV only, I dumped the expensive charting program and switched to Sierra after a stopover at Medved. And if you eventually stop plotting volume, the volume MA or volume line option won't matter.

Strangely saw the same outcome/analysis as you said but without the volume factor as its not something I really understand properly as yet.

Depends on how many charts you've looked at, which, based on your earlier comments, is a lot. You may have picked this up without thinking about it much. Can't say after only one example, but looking at piles and piles of charts is usually the basis for "intuition".

So try not to think too much. :)

Db
 
Hi wasp I wasn't suggesting you follow the way I would trade it, just posting my thoughts

enjoying the read of Db's analysis on volume
 
dc2000 said:
Hi wasp I wasn't suggesting you follow the way I would trade it, just posting my thoughts

enjoying the read of Db's analysis on volume

I know DC, just pointing out my goals on this...

Cheers for your views
 
BIG view

Just zoomed out and looked at this channel break and a possible completed pull back before continuing long... shall be keeping an eye on this view to see how it pans out or if I'm just seeing things :cheesy:
 

Attachments

  • week.gif
    week.gif
    29.4 KB · Views: 308
Handy!

Not really looked at prorealtime before and didn't realise it was so extensive. Anyhow, here is the stock in a more viewable and comprehensive package.

Thanks to JillyB pointing it out in another thread.
 

Attachments

  • ERICB.gif
    ERICB.gif
    42.8 KB · Views: 306
Last edited:
expectancy and %'s

With the discussion on % expectancy on another thread I though I'd include this on a weekly and eventually monthly basis to discover mine. Rather than via backtests I'll do it forward as it is fact based rather than 'in theory'...

Obviously to start off its gonna be pretty weak as its only one week but gotta start somewhere.


last week:

Trades - 23

Won -- 15
Lost -- 8

65% W/L ratio... not the greatest in the world but...

Profit (pips) -- 215

So happy days there really.....

:D
 
Wednesday woes

Fool....

I knew there was a reason for all this talk of discipline...

After getting duped by the BoE minutes I was torn slightly. Having to go out meant popping into a cafe to make use of their WIFI and I took a long before the signal arrised. Naturally by the time I got home again it had droppen through my stop but it was tight and small (the best way :cheesy: ) seeing as it was a bit of a gamble but I didn't know how long I'd be so...

Anyhow, a nice pre announcement signal from my (lagging!) indicators put me in well ahead of the US Open and now just exited at 900 so time for a rest :)
 

Attachments

  • wed.gif
    wed.gif
    26.7 KB · Views: 293
As I said early on (though I don't know which post), you should calculate not only your win:lose ratio (the "success rate") but your profit:loss ratio. In addition, you should determine your maximum single loss and your longest uninterrupted string of losing trades.

If you do this in real time, it's going to take quite some time. However, if your setup is clearly defined, you can also calculate these figures using old charts.

Why all the calculations? Primarily because they will enable you to gain confidence in your strategy (assuming that the numbers inspire confidence in the first place). But it is also important to know how many losers you can expect, partly for your emotional health and partly to obtain an early warning -- if your expected number of losers is exceeded -- that there might be a problem with your strategy.

Db
 
Status
Not open for further replies.
Top